Search Market Research Report

Discover Our Latest Reports
Discover Our Featured Reports
Discover Top Selling Reports

Aerospace & Defense Elastomers Market Size, Share Global Analysis Report, , 2020 – 2026

report img

Aerospace & Defense Elastomers Market By Unsaturated Elastomer (Polyacrylic Rubber, Silicone Rubber, Polyether Block Amides, Ethylene-Vinyl Acetate, Ethylene Propylene Diene Monomer (EPDM), and Others), By Saturated Elastomer (Polybutadiene, Chloroprene Rubber, Butyl Rubber, Nitrile Rubber, Synthetic Polyisoprene, and Others), By Application (O-Rings & Gaskets, Seals, Profiles, Hoses, and Others), and By Sales Channel (Direct Distribution and Indirect Distribution): Global Industry Perspective, Comprehensive Analysis, and Forecast, 2020 – 2026

Industry Insights

[195+ Pages Report] The global aerospace & defense elastomers market is set for rapid growth over the forecast period. In terms of revenue, the global aerospace & defense elastomers market accounted for USD 60 Million in 2019 and is anticipated to reach around USD 90 Million by 2026, growing at a CAGR of 6.1%.

logoGlobal Aerospace & Defense Elastomers Market: Overview

Elastomers are low-elastic-modulus materials that have superior extensibility and durability when stressed but revert to their original dimensions when the deforming stress is withdrawn. Elastomers have very high elasticity, with elongation rates ranging from hundreds to thousands of percent. This makes elastomers ideal for applications requiring low stiffness and high elasticity. As a result, they're used in airplane seals, gaskets, and tires.

logoGlobal Aerospace & Defense Elastomers Market: Growth Factors

The global aerospace and defense elastomers market is expected to grow in the upcoming years due to increasing aircraft demand from developing countries such as China and India. Due to properties such as high elasticity and elongation values, elastomers are widely used in aircraft tires, gaskets, and seals. Additionally, the replacement of existing aircraft with new aircraft is set to propel the aerospace and defense elastomers industry globally. For the first time, the world's commercial aircraft fleet increased by 4% in 2017, reaching greater than 31,000. The number of aircraft on order was almost half it, with an order backlog of almost ten years. Both major aircraft manufactures shipped a record number of aircraft in 2017, and the air fleet is estimated to double in size by 2038 relative to existing conditions, reaching 50,660 aircraft from 25,830 in 2018. As a result, a significant increase in the manufacturing of aircraft is expected to fuel demand for aerospace elastomers. The increase in defense budgets of various developed and developing economies has also boosted demand growth. Business development has been hampered by a lack of expertise as a result of technological advances. Another factor contributing to the sector's slowing growth is the fact that the aerospace industry is cyclic in nature, triggering market swings.

Aerospace & Defense Elastomers Market

To know more about this report | Request Free Sample Copy

logoGlobal Aerospace & Defense Elastomers Market: Segmentation

The global aerospace and defense elastomers market is bifurcated into its unsaturated elastomer, saturated elastomer, application, sales channel, and regions. Based on the unsaturated elastomer, the global market is divided into silicone rubber, ethylene-vinyl acetate, polyacrylic rubber, polyether block amides, ethylene propylene diene monomer (EPDM), and others. Silicone elastomers are used in a variety of industries for sealing applications because they can survive harsh working environments. Silicon elastomers' dominance can be attributed to their widespread adoption in the market, as they have outstanding consistency and general characteristics. Based on the saturated elastomer, the market is bifurcated into chloroprene rubber, nitrile rubber, polybutadiene, butyl rubber, synthetic polyisoprene, and others. Based on the application category, the global market is divided into seals, hoses, o-rings & gaskets, profiles, and others. Static sealing is provided by O-rings and gaskets in several parts of aero engines, such as the fuel systems and gearbox. Landing gear assembly, which includes actuators, wheels & brakes, and hydraulics, and flight control sealing, which includes fuel lines, lubrication, hydraulics, cables, and fuel system seals, are examples of sealing applications. Based on the sales channel, the global market is divided into direct distribution and indirect distribution. Geographically, the global aerospace and defense elastomers market is divided into North America, Asia-Pacific, Europe, Latin America, and Middle East & Africa.

logoGlobal Aerospace & Defense Elastomers Market: Regional Analysis

North America region dominated the global aerospace and defense elastomers market in 2019 and is anticipated to continue its dominance in the upcoming years. This is due to the region's rising business and commercial aviation sector, which has the world's highest demand for aerospace and defense aircraft. In addition, industry growth is anticipated to be fueled by the rapid introduction of new manufacturing technology and substantial investment in research and development activities. The participation of many major industry players such as Chemours, Dow Corning, and Greene, Tweed among others, will help the market expand even further. Furthermore, over the last few years, North America has seen an increase in aircraft deliveries in both commercial and defense applications, which is anticipated to fuel the region's aerospace & defense elastomers industry.

The Asia Pacific aerospace and defense elastomers market is anticipated to grow at a significant rate in the forecast period. The growth of the Asia Pacific region can be attributed to the region's increased emphasis on the construction of aircraft manufacturing facilities. The market's growth is being fueled by encouraging government policies and a growing defense budget. The region's increased commercial and military aircraft production and procurement programs are expected to fuel the market's growth. For example, in December 2018, the Boeing Company and the Commercial Aircraft Corporation of China formed a joint venture to build the first 737 aircraft in China. The Boeing Company spent about USD 33 million in the joint venture and now owns a significant portion of it.

Europe aerospace and defense elastomers market followed North America market in 2019 and is expected to grow at a healthy growth rate in the upcoming years. This is due to increased demand for aerospace & defense elastomers from main Airbus SE and ATR aircraft manufacturing facilities in Germany, U.K., France, and Italy. Furthermore, leading manufacturers such as Wacker Chemie, Trelleborg, Solvay, and Saint-Gobain among others, are present in the field, fueling the market growth over the projected period. Furthermore, the UK authorities' assurances that the UK will remain a member of the European Aviation Safety Agency will not affect the BREXIT agreement also brought relief to UK-based manufacturers. The aerospace and defense elastomers industry in Latin America is dominated by Brazil and Mexico, with Brazil being the largest consumer. Despite its limited scale, the Middle East and Africa aerospace market is anticipated to expand rapidly due to the optimistic outlook of airplane manufacturers to open new bases in the area and its strategic location.

logoReport Scope

Report Attribute

Details

Market Size in 2029

USD 60 Million

Projected Market Size in 2026

USD 90 Million

CAGR Growth Rate

6.1% CAGR

Base Year

2019

Forecast Years

2020-2026

Key Market Players

Chemours, Momentive Performance Materials Inc., Solvay, 3M, Esterline, Technetics, Trelleborg, Specialty Silicone Products, Zeon Chemicals, Jonal Laboratories, Inc., Quantum Silicones, TRP Polymer Solutions Limited, Greene Tweed, Wacker Chemie AG, Saint-Gobain, DOW Corning, Chenguang Fluoro & Silicone Elastomers Co., Ltd., Holland Shielding, Lanxess, Specialised Polymer Engineering, Unimatec, Shin-Etsu Chemical, Polymod Technologies, Rogers Corporation, and Seal Science, Inc among others.

Key Segment

By Raw Material, By Aircraft Type, By End-Use, By Distribution Channel, By Region

Major Regions Covered

North America, Europe, Asia Pacific, Latin America, and the Middle East & Africa

Purchase Options

Request customized purchase options to meet your research needs. Explore purchase options

logoGlobal Aerospace & Defense Elastomers Market: Competitive Players

Some of the key players in the aerospace and defense elastomers market are :

  • Chemours
  • Momentive Performance Materials Inc.
  • Solvay
  • 3M
  • Esterline
  • Technetics
  • Trelleborg
  • Specialty Silicone Products
  • Zeon Chemicals
  • Jonal Laboratories Inc.
  • Quantum Silicones
  • TRP Polymer Solutions Limited
  • Greene Tweed
  • Wacker Chemie AG
  • Saint-Gobain
  • DOW Corning
  • Chenguang Fluoro & Silicone Elastomers Co. Ltd.
  • Holland Shielding
  • Lanxess
  • Specialised Polymer Engineering
  • Unimatec
  • Shin-Etsu Chemical
  • Polymod Technologies
  • Rogers Corporation
  • Seal Science Inc

logoGlobal Aerospace & Defense Elastomers Market: Regional Segment Analysis

  • North America
    • U.S.
    • Canada
  • Europe
    • Germany
    • France
    • U.K.
    • Italy
    • Spain
    • Rest of Europe
  • The Asia Pacific
    • China
    • Japan
    • India
    • South Korea
    • South-East Asia
    • Rest of Asia Pacific
  • Latin America
    • Brazil
    • Mexico
    • Rest of Latin America
  • The Middle East and Africa
    • GCC Countries
    • South Africa
    • Rest of Middle-East Africa

Table of Content

  1. Chapter 1 Executive Summary
    1. 1.1. Introduction of Aerospace & Defense Elastomers
    2. 1.2. Global Aerospace & Defense Elastomers Market, 2019 & 2026 (USD Million)
    3. 1.3. Global Aerospace & Defense Elastomers Market, 2016 – 2026 (USD Million) (Kilo Tons)
    4. 1.4. Global Aerospace & Defense Elastomers Market Absolute Revenue Opportunity, 2016 – 2026 (USD Million)
    5. 1.5. Global Aerospace & Defense Elastomers Market Incremental Revenue Opportunity, 2020 – 2026 (USD Million)
  2. Chapter 2 Aerospace & Defense Elastomers Market – Unsaturated Elastomer Analysis
    1. 2.1. Global Aerospace & Defense Elastomers Market – Unsaturated Elastomer Overview
    2. 2.2. Global Aerospace & Defense Elastomers Market Share, by Unsaturated Elastomer, 2019 & 2026 (USD Million)
    3. 2.3. Global Aerospace & Defense Elastomers Market share, by Unsaturated Elastomer, 2019 & 2026 (Kilo Tons)
    4. 2.4. Polyacrylic Rubber
      1. 2.4.1. Global Polyacrylic Rubber Aerospace & Defense Elastomers Market, 2016 – 2026 (USD Million)
      2. 2.4.2. Global Polyacrylic Rubber Aerospace & Defense Elastomers Market, 2016 – 2026 (Kilo Tons)
    5. 2.5. Silicone Rubber
      1. 2.5.1. Global Silicone Rubber Aerospace & Defense Elastomers Market, 2016 – 2026 (USD Million)
      2. 2.5.2. Global Silicone Rubber Aerospace & Defense Elastomers Market, 2016 – 2026 (Kilo Tons)
    6. 2.6. Polyether Block Amides
      1. 2.6.1. Global Polyether Block Amides Aerospace & Defense Elastomers Market, 2016 – 2026 (USD Million)
      2. 2.6.2. Global Polyether Block Amides Aerospace & Defense Elastomers Market, 2016 – 2026 (Kilo Tons)
    7. 2.7. Ethylene-Vinyl Acetate
      1. 2.7.1. Global Ethylene-Vinyl Acetate Aerospace & Defense Elastomers Market, 2016 – 2026 (USD Million)
      2. 2.7.2. Global Ethylene-Vinyl Acetate Aerospace & Defense Elastomers Market, 2016 – 2026 (Kilo Tons)
    8. 2.8. Ethylene Propylene Diene Monomer (EPDM)
      1. 2.8.1. Global Ethylene Propylene Diene Monomer (EPDM) Aerospace & Defense Elastomers Market, 2016 – 2026 (USD Million)
      2. 2.8.2. Global Ethylene Propylene Diene Monomer (EPDM) Aerospace & Defense Elastomers Market, 2016 – 2026 (Kilo Tons)
    9. 2.9. Others
      1. 2.9.1. Global Others Aerospace & Defense Elastomers Market, 2016 – 2026 (USD Million)
      2. 2.9.2. Global Others Aerospace & Defense Elastomers Market, 2016 – 2026 (Kilo Tons)
  3. Chapter 3 Aerospace & Defense Elastomers Market – Saturated Elastomer Analysis
    1. 3.1. Global Aerospace & Defense Elastomers Market – Saturated Elastomer Overview
    2. 3.2. Global Aerospace & Defense Elastomers Market Share, by Saturated Elastomer, 2019 & 2026 (USD Million)
    3. 3.3. Global Aerospace & Defense Elastomers Market share, by Saturated Elastomer, 2019 & 2026 (Kilo Tons)
    4. 3.4. Polybutadiene
      1. 3.4.1. Global Polybutadiene Aerospace & Defense Elastomers Market, 2016 – 2026 (USD Million)
      2. 3.4.2. Global Polybutadiene Aerospace & Defense Elastomers Market, 2016 – 2026 (Kilo Tons)
    5. 3.5. Chloroprene Rubber
      1. 3.5.1. Global Chloroprene Rubber Aerospace & Defense Elastomers Market, 2016 – 2026 (USD Million)
      2. 3.5.2. Global Chloroprene Rubber Aerospace & Defense Elastomers Market, 2016 – 2026 (Kilo Tons)
    6. 3.6. Butyl Rubber
      1. 3.6.1. Global Butyl Rubber Aerospace & Defense Elastomers Market, 2016 – 2026 (USD Million)
      2. 3.6.2. Global Butyl Rubber Aerospace & Defense Elastomers Market, 2016 – 2026 (Kilo Tons)
    7. 3.7. Nitrile Rubber
      1. 3.7.1. Global Nitrile Rubber Aerospace & Defense Elastomers Market, 2016 – 2026 (USD Million)
      2. 3.7.2. Global Nitrile Rubber Aerospace & Defense Elastomers Market, 2016 – 2026 (Kilo Tons)
    8. 3.8. Synthetic Polyisoprene
      1. 3.8.1. Global Synthetic Polyisoprene Aerospace & Defense Elastomers Market, 2016 – 2026 (USD Million)
      2. 3.8.2. Global Synthetic Polyisoprene Aerospace & Defense Elastomers Market, 2016 – 2026 (Kilo Tons)
    9. 3.9. Others
      1. 3.9.1. Global Others Aerospace & Defense Elastomers Market, 2016 – 2026 (USD Million)
      2. 3.9.2. Global Others Aerospace & Defense Elastomers Market, 2016 – 2026 (Kilo Tons)
  4. Chapter 4 Aerospace & Defense Elastomers Market – Application Analysis
    1. 4.1. Global Aerospace & Defense Elastomers Market – Application Overview
    2. 4.2. Global Aerospace & Defense Elastomers Market Share, by Application, 2019 & 2026 (USD Million)
    3. 4.3. Global Aerospace & Defense Elastomers Market share, by Application, 2019 & 2026 (Kilo Tons)
    4. 4.4. O-Rings & Gaskets
      1. 4.4.1. Global O-Rings & Gaskets Aerospace & Defense Elastomers Market, 2016 – 2026 (USD Million)
      2. 4.4.2. Global O-Rings & Gaskets Aerospace & Defense Elastomers Market, 2016 – 2026 (Kilo Tons)
    5. 4.5. Seals
      1. 4.5.1. Global Seals Aerospace & Defense Elastomers Market, 2016 – 2026 (USD Million)
      2. 4.5.2. Global Seals Aerospace & Defense Elastomers Market, 2016 – 2026 (Kilo Tons)
    6. 4.6. Profiles
      1. 4.6.1. Global Profiles Aerospace & Defense Elastomers Market, 2016 – 2026 (USD Million)
      2. 4.6.2. Global Profiles Aerospace & Defense Elastomers Market, 2016 – 2026 (Kilo Tons)
    7. 4.7. Hoses
      1. 4.7.1. Global Hoses Aerospace & Defense Elastomers Market, 2016 – 2026 (USD Million)
      2. 4.7.2. Global Hoses Aerospace & Defense Elastomers Market, 2016 – 2026 (Kilo Tons)
    8. 4.8. Others
      1. 4.8.1. Global Others Aerospace & Defense Elastomers Market, 2016 – 2026 (USD Million)
      2. 4.8.2. Global Others Aerospace & Defense Elastomers Market, 2016 – 2026 (Kilo Tons)
  5. Chapter 5 Aerospace & Defense Elastomers Market – Sales Channel Analysis
    1. 5.1. Global Aerospace & Defense Elastomers Market – Sales Channel Overview
    2. 5.2. Global Aerospace & Defense Elastomers Market Share, by Sales Channel, 2019 & 2026 (USD Million)
    3. 5.3. Global Aerospace & Defense Elastomers Market share, by Sales Channel, 2019 & 2026 (Kilo Tons)
    4. 5.4. Direct Distribution
      1. 5.4.1. Global Direct Distribution Aerospace & Defense Elastomers Market, 2016 – 2026 (USD Million)
      2. 5.4.2. Global Direct Distribution Aerospace & Defense Elastomers Market, 2016 – 2026 (Kilo Tons)
    5. 5.5. Indirect Distribution
      1. 5.5.1. Global Indirect Distribution Aerospace & Defense Elastomers Market, 2016 – 2026 (USD Million)
      2. 5.5.2. Global Indirect Distribution Aerospace & Defense Elastomers Market, 2016 – 2026 (Kilo Tons)
  6. Chapter 6 Aerospace & Defense Elastomers Market – Regional Analysis
    1. 6.1. Global Aerospace & Defense Elastomers Market Regional Overview
    2. 6.2. Global Aerospace & Defense Elastomers Market Share, by Region, 2019 & 2026 (USD Million)
    3. 6.3. Global Aerospace & Defense Elastomers Market Share, by Region, 2019 & 2026 (Kilo Tons)
    4. 6.4. North America
      1. 6.4.1. North America Aerospace & Defense Elastomers Market, 2016 – 2026 (USD Million)
        1. 6.4.1.1. North America Aerospace & Defense Elastomers Market, by Country, 2016 – 2026 (USD Million)
      2. 6.4.2. North America Market, 2016 – 2026 (Kilo Tons)
        1. 6.4.2.1. North America Aerospace & Defense Elastomers Market, by Country, 2016 – 2026 (Kilo Tons)
      3. 6.4.3. North America Aerospace & Defense Elastomers Market, by Unsaturated Elastomer, 2016 – 2026
        1. 6.4.3.1. North America Aerospace & Defense Elastomers Market, by Unsaturated Elastomer, 2016 – 2026 (USD Million)
        2. 6.4.3.2. North America Aerospace & Defense Elastomers Market, by Unsaturated Elastomer, 2016 – 2026 (Kilo Tons)
      4. 6.4.4. North America Aerospace & Defense Elastomers Market, by Saturated Elastomer, 2016 – 2026
        1. 6.4.4.1. North America Aerospace & Defense Elastomers Market, by Saturated Elastomer, 2016 – 2026 (USD Million)
        2. 6.4.4.2. North America Aerospace & Defense Elastomers Market, by Saturated Elastomer, 2016 – 2026 (Kilo Tons)
      5. 6.4.5. North America Aerospace & Defense Elastomers Market, by Application, 2016 – 2026
        1. 6.4.5.1. North America Aerospace & Defense Elastomers Market, by Application, 2016 – 2026 (USD Million)
        2. 6.4.5.2. North America Aerospace & Defense Elastomers Market, by Application, 2016 – 2026 (Kilo Tons)
      6. 6.4.6. North America Aerospace & Defense Elastomers Market, by Sales Channel, 2016 – 2026
        1. 6.4.6.1. North America Aerospace & Defense Elastomers Market, by Sales Channel, 2016 – 2026 (USD Million)
        2. 6.4.6.2. North America Aerospace & Defense Elastomers Market, by Sales Channel, 2016 – 2026 (Kilo Tons)
          1. 6.4.7. U.S.
            1. 6.4.7.1. U.S. Aerospace & Defense Elastomers Market, 2016 – 2026 (USD Million)
            2. 6.4.7.2. U.S. Aerospace & Defense Elastomers Market, 2016 – 2026 (Kilo Tons)
      7. 6.4.8. Canada
        1. 6.4.8.1. Canada Aerospace & Defense Elastomers Market, 2016 – 2026 (USD Million)
        2. 6.4.8.2. Canada Aerospace & Defense Elastomers Market, 2016 – 2026 (Kilo Tons)
    5. 6.5. Europe
      1. 6.5.1. Europe Aerospace & Defense Elastomers Market, 2016 – 2026 (USD Million)
        1. 6.5.1.1. Europe Aerospace & Defense Elastomers Market, by Country, 2016 – 2026 (USD Million)
      2. 6.5.2. Europe Market, 2016 – 2026 (Kilo Tons)
        1. 6.5.2.1. Europe Aerospace & Defense Elastomers Market, by Country, 2016 – 2026 (Kilo Tons)
      3. 6.5.3. Europe Aerospace & Defense Elastomers Market, by Unsaturated Elastomer, 2016 – 2026
        1. 6.5.3.1. Europe Aerospace & Defense Elastomers Market, by Unsaturated Elastomer, 2016 – 2026 (USD Million)
        2. 6.5.3.2. Europe Aerospace & Defense Elastomers Market, by Unsaturated Elastomer, 2016 – 2026 (Kilo Tons)
      4. 6.5.4. Europe Aerospace & Defense Elastomers Market, by Saturated Elastomer, 2016 – 2026
        1. 6.5.4.1. Europe Aerospace & Defense Elastomers Market, by Saturated Elastomer, 2016 – 2026 (USD Million)
        2. 6.5.4.2. Europe Aerospace & Defense Elastomers Market, by Saturated Elastomer, 2016 – 2026 (Kilo Tons)
      5. 6.5.5. Europe Aerospace & Defense Elastomers Market, by Application, 2016 – 2026
        1. 6.5.5.1. Europe Aerospace & Defense Elastomers Market, by Application, 2016 – 2026 (USD Million)
        2. 6.5.5.2. Europe Aerospace & Defense Elastomers Market, by Application, 2016 – 2026 (Kilo Tons)
      6. 6.5.6. Europe Aerospace & Defense Elastomers Market, by Sales Channel, 2016 – 2026
        1. 6.5.6.1. Europe Aerospace & Defense Elastomers Market, by Sales Channel, 2016 – 2026 (USD Million)
        2. 6.5.6.2. Europe Aerospace & Defense Elastomers Market, by Sales Channel, 2016 – 2026 (Kilo Tons)
      7. 6.5.7. Germany
        1. 6.5.7.1. Germany Aerospace & Defense Elastomers Market, 2016 – 2026 (USD Million)
        2. 6.5.7.2. Germany Aerospace & Defense Elastomers Market, 2016 – 2026 (Kilo Tons)
      8. 6.5.8. France
        1. 6.5.8.1. France Aerospace & Defense Elastomers Market, 2016 – 2026 (USD Million)
        2. 6.5.8.2. France Aerospace & Defense Elastomers Market, 2016 – 2026 (Kilo Tons)
          1. 6.5.9. U.K.
            1. 6.5.9.1. U.K. Aerospace & Defense Elastomers Market, 2016 – 2026 (USD Million)
            2. 6.5.9.2. U.K. Aerospace & Defense Elastomers Market, 2016 – 2026 (Kilo Tons)
      9. 6.5.10. Italy
        1. 6.5.10.1. Italy Aerospace & Defense Elastomers Market, 2016 – 2026 (USD Million)
        2. 6.5.10.2. Italy Aerospace & Defense Elastomers Market, 2016 – 2026 (Kilo Tons)
      10. 6.5.11. Spain
        1. 6.5.11.1. Spain Aerospace & Defense Elastomers Market, 2016 – 2026 (USD Million)
        2. 6.5.11.2. Spain Aerospace & Defense Elastomers Market, 2016 – 2026 (Kilo Tons)
      11. 6.5.12. Rest of Europe
        1. 6.5.12.1. Rest of Europe Aerospace & Defense Elastomers Market, 2016 – 2026 (USD Million)
        2. 6.5.12.2. Rest of Europe Aerospace & Defense Elastomers Market, 2016 – 2026 (Kilo Tons)
    6. 6.6. Asia Pacific
      1. 6.6.1. Asia Pacific Aerospace & Defense Elastomers Market, 2016 – 2026 (USD Million)
        1. 6.6.1.1. Asia Pacific Aerospace & Defense Elastomers Market, by Country, 2016 – 2026 (USD Million)
      2. 6.6.2. Asia Pacific Market, 2016 – 2026 (Kilo Tons)
        1. 6.6.2.1. Asia Pacific Aerospace & Defense Elastomers Market, by Country, 2016 – 2026 (Kilo Tons)
      3. 6.6.3. Asia Pacific Aerospace & Defense Elastomers Market, by Unsaturated Elastomer, 2016 – 2026
        1. 6.6.3.1. Asia Pacific Aerospace & Defense Elastomers Market, by Unsaturated Elastomer, 2016 – 2026 (USD Million)
        2. 6.6.3.2. Asia Pacific Aerospace & Defense Elastomers Market, by Unsaturated Elastomer, 2016 – 2026 (Kilo Tons)
      4. 6.6.4. Asia Pacific Aerospace & Defense Elastomers Market, by Saturated Elastomer, 2016 – 2026
        1. 6.6.4.1. Asia Pacific Aerospace & Defense Elastomers Market, by Saturated Elastomer, 2016 – 2026 (USD Million)
        2. 6.6.4.2. Asia Pacific Aerospace & Defense Elastomers Market, by Saturated Elastomer, 2016 – 2026 (Kilo Tons)
      5. 6.6.5. Asia Pacific Aerospace & Defense Elastomers Market, by Application, 2016 – 2026
        1. 6.6.5.1. Asia Pacific Aerospace & Defense Elastomers Market, by Application, 2016 – 2026 (USD Million)
        2. 6.6.5.2. Asia Pacific Aerospace & Defense Elastomers Market, by Application, 2016 – 2026 (Kilo Tons)
      6. 6.6.6. Asia Pacific Aerospace & Defense Elastomers Market, by Sales Channel, 2016 – 2026
        1. 6.6.6.1. Asia Pacific Aerospace & Defense Elastomers Market, by Sales Channel, 2016 – 2026 (USD Million)
        2. 6.6.6.2. Asia Pacific Aerospace & Defense Elastomers Market, by Sales Channel, 2016 – 2026 (Kilo Tons)
      7. 6.6.7. China
        1. 6.6.7.1. China Aerospace & Defense Elastomers Market, 2016 – 2026 (USD Million)
        2. 6.6.7.2. China Aerospace & Defense Elastomers Market, 2016 – 2026 (Kilo Tons)
      8. 6.6.8. Japan
        1. 6.6.8.1. Japan Aerospace & Defense Elastomers Market, 2016 – 2026 (USD Million)
        2. 6.6.8.2. Japan Aerospace & Defense Elastomers Market, 2016 – 2026 (Kilo Tons)
      9. 6.6.9. India
        1. 6.6.9.1. India Aerospace & Defense Elastomers Market, 2016 – 2026 (USD Million)
        2. 6.6.9.2. India Aerospace & Defense Elastomers Market, 2016 – 2026 (Kilo Tons)
      10. 6.6.10. South Korea
        1. 6.6.10.1. South Korea Aerospace & Defense Elastomers Market, 2016 – 2026 (USD Million)
        2. 6.6.10.2. South Korea Aerospace & Defense Elastomers Market, 2016 – 2026 (Kilo Tons)
      11. 6.6.11. South-East Asia
        1. 6.6.11.1. South-East Asia Aerospace & Defense Elastomers Market, 2016 – 2026 (USD Million)
        2. 6.6.11.2. South-East Asia Aerospace & Defense Elastomers Market, 2016 – 2026 (Kilo Tons)
      12. 6.6.12. Rest of Asia Pacific
        1. 6.6.12.1. Rest of Asia Pacific Aerospace & Defense Elastomers Market, 2016 – 2026 (USD Million)
        2. 6.6.12.2. Rest of Asia Pacific Aerospace & Defense Elastomers Market, 2016 – 2026 (Kilo Tons)
    7. 6.7. Latin America
      1. 6.7.1. Latin America Aerospace & Defense Elastomers Market, 2016 – 2026 (USD Million)
        1. 6.7.1.1. Latin America Aerospace & Defense Elastomers Market, by Country, 2016 – 2026 (USD Million)
      2. 6.7.2. Latin America Market, 2016 – 2026 (Kilo Tons)
        1. 6.7.2.1. Latin America Aerospace & Defense Elastomers Market, by Country, 2016 – 2026 (Kilo Tons)
      3. 6.7.3. Latin America Aerospace & Defense Elastomers Market, by Unsaturated Elastomer, 2016 – 2026
        1. 6.7.3.1. Latin America Aerospace & Defense Elastomers Market, by Unsaturated Elastomer, 2016 – 2026 (USD Million)
        2. 6.7.3.2. Latin America Aerospace & Defense Elastomers Market, by Unsaturated Elastomer, 2016 – 2026 (Kilo Tons)
      4. 6.7.4. Latin America Aerospace & Defense Elastomers Market, by Saturated Elastomer, 2016 – 2026
        1. 6.7.4.1. Latin America Aerospace & Defense Elastomers Market, by Saturated Elastomer, 2016 – 2026 (USD Million)
        2. 6.7.4.2. Latin America Aerospace & Defense Elastomers Market, by Saturated Elastomer, 2016 – 2026 (Kilo Tons)
      5. 6.7.5. Latin America Aerospace & Defense Elastomers Market, by Application, 2016 – 2026
        1. 6.7.5.1. Latin America Aerospace & Defense Elastomers Market, by Application, 2016 – 2026 (USD Million)
        2. 6.7.5.2. Latin America Aerospace & Defense Elastomers Market, by Application, 2016 – 2026 (Kilo Tons)
      6. 6.7.6. Latin America Aerospace & Defense Elastomers Market, by Sales Channel, 2016 – 2026
        1. 6.7.6.1. Latin America Aerospace & Defense Elastomers Market, by Sales Channel, 2016 – 2026 (USD Million)
        2. 6.7.6.2. Latin America Aerospace & Defense Elastomers Market, by Sales Channel, 2016 – 2026 (Kilo Tons)
      7. 6.7.7. Brazil
        1. 6.7.7.1. Brazil Aerospace & Defense Elastomers Market, 2016 – 2026 (USD Million)
        2. 6.7.7.2. Brazil Aerospace & Defense Elastomers Market, 2016 – 2026 (Kilo Tons)
      8. 6.7.8. Mexico
        1. 6.7.8.1. Mexico Aerospace & Defense Elastomers Market, 2016 – 2026 (USD Million)
        2. 6.7.8.2. Mexico Aerospace & Defense Elastomers Market, 2016 – 2026 (Kilo Tons)
      9. 6.7.9. Rest of Latin America
        1. 6.7.9.1. Rest of Latin America Aerospace & Defense Elastomers Market, 2016 – 2026 (USD Million)
        2. 6.7.9.2. Rest of Latin America Aerospace & Defense Elastomers Market, 2016 – 2026 (Kilo Tons)
    8. 6.8. The Middle-East and Africa
      1. 6.8.1. The Middle-East and Africa Aerospace & Defense Elastomers Market, 2016 – 2026 (USD Million)
        1. 6.8.1.1. The Middle-East and Africa Aerospace & Defense Elastomers Market, by Country, 2016 – 2026 (USD Million)
      2. 6.8.2. The Middle-East and Africa Market, 2016 – 2026 (Kilo Tons)
        1. 6.8.2.1. The Middle-East and Africa Aerospace & Defense Elastomers Market, by Country, 2016 – 2026 (Kilo Tons)
      3. 6.8.3. The Middle-East and Africa Aerospace & Defense Elastomers Market, by Unsaturated Elastomer, 2016 – 2026
        1. 6.8.3.1. The Middle-East and Africa Aerospace & Defense Elastomers Market, by Unsaturated Elastomer, 2016 – 2026 (USD Million)
        2. 6.8.3.2. The Middle-East and Africa Aerospace & Defense Elastomers Market, by Unsaturated Elastomer, 2016 – 2026 (Kilo Tons)
      4. 6.8.4. The Middle-East and Africa Aerospace & Defense Elastomers Market, by Saturated Elastomer, 2016 – 2026
        1. 6.8.4.1. The Middle-East and Africa Aerospace & Defense Elastomers Market, by Saturated Elastomer, 2016 – 2026 (USD Million)
        2. 6.8.4.2. The Middle-East and Africa Aerospace & Defense Elastomers Market, by Saturated Elastomer, 2016 – 2026 (Kilo Tons)
      5. 6.8.5. The Middle-East and Africa Aerospace & Defense Elastomers Market, by Application, 2016 – 2026
        1. 6.8.5.1. The Middle-East and Africa Aerospace & Defense Elastomers Market, by Application, 2016 – 2026 (USD Million)
        2. 6.8.5.2. The Middle-East and Africa Aerospace & Defense Elastomers Market, by Application, 2016 – 2026 (Kilo Tons)
      6. 6.8.6. The Middle-East and Africa Aerospace & Defense Elastomers Market, by Sales Channel, 2016 – 2026
        1. 6.8.6.1. The Middle-East and Africa Aerospace & Defense Elastomers Market, by Sales Channel, 2016 – 2026 (USD Million)
        2. 6.8.6.2. The Middle-East and Africa Aerospace & Defense Elastomers Market, by Sales Channel, 2016 – 2026 (Kilo Tons)
      7. 6.8.7. GCC Countries
        1. 6.8.7.1. GCC Countries Aerospace & Defense Elastomers Market, 2016 – 2026 (USD Million)
        2. 6.8.7.2. GCC Countries Aerospace & Defense Elastomers Market, 2016 – 2026 (Kilo Tons)
      8. 6.8.8. South Africa
        1. 6.8.8.1. South Africa Aerospace & Defense Elastomers Market, 2016 – 2026 (USD Million)
        2. 6.8.8.2. South Africa Aerospace & Defense Elastomers Market, 2016 – 2026 (Kilo Tons)
      9. 6.8.9. Rest of Middle-East Africa
        1. 6.8.9.1. Rest of Middle-East Africa Aerospace & Defense Elastomers Market, 2016 – 2026 (USD Million)
        2. 6.8.9.2. Rest of Middle-East Africa Aerospace & Defense Elastomers Market, 2016 – 2026 (Kilo Tons)
  7. Chapter 7 Aerospace & Defense Elastomers Production, Consumption, Export, Import by Regions
    1. 7.1. Global Aerospace & Defense Elastomers Production and Consumption, 2016 – 2026 (Kilo Tons)
    2. 7.2. Global Import and Export Analysis, by Region
  8. Chapter 8 Aerospace & Defense Elastomers Market – Competitive Landscape
    1. 8.1. Competitor Market Share – Revenue
    2. 8.2. Market Concentration Rate Analysis, Top 3 and Top 5 Players
    3. 8.3. Competitor Market Share – Volume
    4. 8.4. Strategic Developments
      1. 8.4.1. Acquisitions and Mergers
      2. 8.4.2. New Products
      3. 8.4.3. Research & Development Activities
  9. Chapter 9 Company Profiles
    1. 9.1. Greene Tweed
      1. 9.1.1. Company Overview
      2. 9.1.2. Product/Service Portfolio
      3. 9.1.3. Greene Tweed Sales, Revenue, Price, and Gross Margin
      4. 9.1.4. Greene Tweed Revenue and Growth Rate
      5. 9.1.5. Greene Tweed Market Share
      6. 9.1.6. Recent Initiatives, Funding/VC Activities, and Technological Innovations
    2. 9.2. Chemours
      1. 9.2.1. Company Overview
      2. 9.2.2. Product/Service Portfolio
      3. 9.2.3. Chemours Sales, Revenue, Price, and Gross Margin
      4. 9.2.4. Chemours Revenue and Growth Rate
      5. 9.2.5. Chemours Market Share
      6. 9.2.6. Recent Initiatives, Funding/VC Activities, and Technological Innovations
    3. 9.3. Wacker Chemie AG
      1. 9.3.1. Company Overview
      2. 9.3.2. Product/Service Portfolio
      3. 9.3.3. Wacker Chemie AG Sales, Revenue, Price, and Gross Margin
      4. 9.3.4. Wacker Chemie AG Revenue and Growth Rate
      5. 9.3.5. Wacker Chemie AG Market Share
      6. 9.3.6. Recent Initiatives, Funding/VC Activities, and Technological Innovations
    4. 9.4. Momentive Performance Materials Inc.
      1. 9.4.1. Company Overview
      2. 9.4.2. Product/Service Portfolio
      3. 9.4.3. Momentive Performance Materials Inc. Sales, Revenue, Price, and Gross Margin
      4. 9.4.4. Momentive Performance Materials Inc. Revenue and Growth Rate
      5. 9.4.5. Momentive Performance Materials Inc. Market Share
      6. 9.4.6. Recent Initiatives, Funding/VC Activities, and Technological Innovations
    5. 9.5. Saint-Gobain
      1. 9.5.1. Company Overview
      2. 9.5.2. Product/Service Portfolio
      3. 9.5.3. Saint-Gobain Sales, Revenue, Price, and Gross Margin
      4. 9.5.4. Saint-Gobain Revenue and Growth Rate
      5. 9.5.5. Saint-Gobain Market Share
      6. 9.5.6. Recent Initiatives, Funding/VC Activities, and Technological Innovations
    6. 9.6. Solvay
      1. 9.6.1. Company Overview
      2. 9.6.2. Product/Service Portfolio
      3. 9.6.3. Solvay Sales, Revenue, Price, and Gross Margin
      4. 9.6.4. Solvay Revenue and Growth Rate
      5. 9.6.5. Solvay Market Share
      6. 9.6.6. Recent Initiatives, Funding/VC Activities, and Technological Innovations
    7. 9.7. DOW Corning
      1. 9.7.1. Company Overview
      2. 9.7.2. Product/Service Portfolio
      3. 9.7.3. DOW Corning Sales, Revenue, Price, and Gross Margin
      4. 9.7.4. DOW Corning Revenue and Growth Rate
      5. 9.7.5. DOW Corning Market Share
      6. 9.7.6. Recent Initiatives, Funding/VC Activities, and Technological Innovations
    8. 9.8. 3M
      1. 9.8.1. Company Overview
      2. 9.8.2. Product/Service Portfolio
      3. 9.8.3. 3M Sales, Revenue, Price, and Gross Margin
      4. 9.8.4. 3M Revenue and Growth Rate
      5. 9.8.5. 3M Market Share
      6. 9.8.6. Recent Initiatives, Funding/VC Activities, and Technological Innovations
    9. 9.9. Chenguang Fluoro & Silicone Elastomers Co., Ltd.
      1. 9.9.1. Company Overview
      2. 9.9.2. Product/Service Portfolio
      3. 9.9.3. Chenguang Fluoro & Silicone Elastomers Co., Ltd. Sales, Revenue, Price, and Gross Margin
      4. 9.9.4. Chenguang Fluoro & Silicone Elastomers Co., Ltd. Revenue and Growth Rate
      5. 9.9.5. Chenguang Fluoro & Silicone Elastomers Co., Ltd. Market Share
      6. 9.9.6. Recent Initiatives, Funding/VC Activities, and Technological Innovations
    10. 9.10. Esterline
      1. 9.10.1. Company Overview
      2. 9.10.2. Product/Service Portfolio
      3. 9.10.3. Esterline Sales, Revenue, Price, and Gross Margin
      4. 9.10.4. Esterline Revenue and Growth Rate
      5. 9.10.5. Esterline Market Share
      6. 9.10.6. Recent Initiatives, Funding/VC Activities, and Technological Innovations
    11. 9.11. Holland Shielding
      1. 9.11.1. Company Overview
      2. 9.11.2. Product/Service Portfolio
      3. 9.11.3. Holland Shielding Sales, Revenue, Price, and Gross Margin
      4. 9.11.4. Holland Shielding Revenue and Growth Rate
      5. 9.11.5. Holland Shielding Market Share
      6. 9.11.6. Recent Initiatives, Funding/VC Activities, and Technological Innovations
    12. 9.12. Technetics
      1. 9.12.1. Company Overview
      2. 9.12.2. Product/Service Portfolio
      3. 9.12.3. Technetics Sales, Revenue, Price, and Gross Margin
      4. 9.12.4. Technetics Revenue and Growth Rate
      5. 9.12.5. Technetics Market Share
      6. 9.12.6. Recent Initiatives, Funding/VC Activities, and Technological Innovations
    13. 9.13. Lanxess
      1. 9.13.1. Company Overview
      2. 9.13.2. Product/Service Portfolio
      3. 9.13.3. Lanxess Sales, Revenue, Price, and Gross Margin
      4. 9.13.4. Lanxess Revenue and Growth Rate
      5. 9.13.5. Lanxess Market Share
      6. 9.13.6. Recent Initiatives, Funding/VC Activities, and Technological Innovations
    14. 9.14. Trelleborg
      1. 9.14.1. Company Overview
      2. 9.14.2. Product/Service Portfolio
      3. 9.14.3. Trelleborg Sales, Revenue, Price, and Gross Margin
      4. 9.14.4. Trelleborg Revenue and Growth Rate
      5. 9.14.5. Trelleborg Market Share
      6. 9.14.6. Recent Initiatives, Funding/VC Activities, and Technological Innovations
    15. 9.15. Specialised Polymer Engineering
      1. 9.15.1. Company Overview
      2. 9.15.2. Product/Service Portfolio
      3. 9.15.3. Specialised Polymer Engineering Sales, Revenue, Price, and Gross Margin
      4. 9.15.4. Specialised Polymer Engineering Revenue and Growth Rate
      5. 9.15.5. Specialised Polymer Engineering Market Share
      6. 9.15.6. Recent Initiatives, Funding/VC Activities, and Technological Innovations
    16. 9.16. Specialty Silicone Products
      1. 9.16.1. Company Overview
      2. 9.16.2. Product/Service Portfolio
      3. 9.16.3. Specialty Silicone Products Sales, Revenue, Price, and Gross Margin
      4. 9.16.4. Specialty Silicone Products Revenue and Growth Rate
      5. 9.16.5. Specialty Silicone Products Market Share
      6. 9.16.6. Recent Initiatives, Funding/VC Activities, and Technological Innovations
    17. 9.17. Unimatec
      1. 9.17.1. Company Overview
      2. 9.17.2. Product/Service Portfolio
      3. 9.17.3. Unimatec Sales, Revenue, Price, and Gross Margin
      4. 9.17.4. Unimatec Revenue and Growth Rate
      5. 9.17.5. Unimatec Market Share
      6. 9.17.6. Recent Initiatives, Funding/VC Activities, and Technological Innovations
    18. 9.18. Zeon Chemicals
      1. 9.18.1. Company Overview
      2. 9.18.2. Product/Service Portfolio
      3. 9.18.3. Zeon Chemicals Sales, Revenue, Price, and Gross Margin
      4. 9.18.4. Zeon Chemicals Revenue and Growth Rate
      5. 9.18.5. Zeon Chemicals Market Share
      6. 9.18.6. Recent Initiatives, Funding/VC Activities, and Technological Innovations
    19. 9.19. Shin-Etsu Chemical
      1. 9.19.1. Company Overview
      2. 9.19.2. Product/Service Portfolio
      3. 9.19.3. Shin-Etsu Chemical Sales, Revenue, Price, and Gross Margin
      4. 9.19.4. Shin-Etsu Chemical Revenue and Growth Rate
      5. 9.19.5. Shin-Etsu Chemical Market Share
      6. 9.19.6. Recent Initiatives, Funding/VC Activities, and Technological Innovations
    20. 9.20. Jonal Laboratories, Inc.
      1. 9.20.1. Company Overview
      2. 9.20.2. Product/Service Portfolio
      3. 9.20.3. Jonal Laboratories, Inc. Sales, Revenue, Price, and Gross Margin
      4. 9.20.4. Jonal Laboratories, Inc. Revenue and Growth Rate
      5. 9.20.5. Jonal Laboratories, Inc. Market Share
      6. 9.20.6. Recent Initiatives, Funding/VC Activities, and Technological Innovations
    21. 9.21. Polymod Technologies
      1. 9.21.1. Company Overview
      2. 9.21.2. Product/Service Portfolio
      3. 9.21.3. Polymod Technologies Sales, Revenue, Price, and Gross Margin
      4. 9.21.4. Polymod Technologies Revenue and Growth Rate
      5. 9.21.5. Polymod Technologies Market Share
      6. 9.21.6. Recent Initiatives, Funding/VC Activities, and Technological Innovations
    22. 9.22. Quantum Silicones
      1. 9.22.1. Company Overview
      2. 9.22.2. Product/Service Portfolio
      3. 9.22.3. Quantum Silicones Sales, Revenue, Price, and Gross Margin
      4. 9.22.4. Quantum Silicones Revenue and Growth Rate
      5. 9.22.5. Quantum Silicones Market Share
      6. 9.22.6. Recent Initiatives, Funding/VC Activities, and Technological Innovations
    23. 9.23. Rogers Corporation
      1. 9.23.1. Company Overview
      2. 9.23.2. Product/Service Portfolio
      3. 9.23.3. Rogers Corporation Sales, Revenue, Price, and Gross Margin
      4. 9.23.4. Rogers Corporation Revenue and Growth Rate
      5. 9.23.5. Rogers Corporation Market Share
      6. 9.23.6. Recent Initiatives, Funding/VC Activities, and Technological Innovations
    24. 9.24. TRP Polymer Solutions Limited
      1. 9.24.1. Company Overview
      2. 9.24.2. Product/Service Portfolio
      3. 9.24.3. TRP Polymer Solutions Limited Sales, Revenue, Price, and Gross Margin
      4. 9.24.4. TRP Polymer Solutions Limited Revenue and Growth Rate
      5. 9.24.5. TRP Polymer Solutions Limited Market Share
      6. 9.24.6. Recent Initiatives, Funding/VC Activities, and Technological Innovations
    25. 9.25. Seal Science, Inc
      1. 9.25.1. Company Overview
      2. 9.25.2. Product/Service Portfolio
      3. 9.25.3. Seal Science, Inc Sales, Revenue, Price, and Gross Margin
      4. 9.25.4. Seal Science, Inc Revenue and Growth Rate
      5. 9.25.5. Seal Science, Inc Market Share
      6. 9.25.6. Recent Initiatives, Funding/VC Activities, and Technological Innovations
  10. Chapter 10 Aerospace & Defense Elastomers — Industry Analysis
    1. 10.1. Introduction and Taxonomy
    2. 10.2. Aerospace & Defense Elastomers Market – Key Trends
      1. 10.2.1. Market Drivers
      2. 10.2.2. Market Restraints
      3. 10.2.3. Market Opportunities
    3. 10.3. Value Chain Analysis
    4. 10.4. Key Mandates and Regulations
    5. 10.5. Technology Roadmap and Timeline
    6. 10.6. Aerospace & Defense Elastomers Market – Attractiveness Analysis
      1. 10.6.1. By Unsaturated Elastomer
      2. 10.6.2. By Saturated Elastomer
      3. 10.6.3. By Application
      4. 10.6.4. By Sales Channel
      5. 10.6.5. By Region
  11. Chapter 11 Raw Material Analysis
    1. 11.1. Aerospace & Defense Elastomers Key Raw Material Analysis
      1. 11.1.1. Key Raw Materials
      2. 11.1.2. Price Trend of Key Raw Materials
    2. 11.2. Key Suppliers of Raw Materials
    3. 11.3. Proportion of Manufacturing Cost Structure
      1. 11.3.1. Raw Materials Cost
      2. 11.3.2. Labor Cost
      3. 11.3.3. Manufacturing Expenses
      4. 11.3.4. Miscellaneous Expenses
    4. 11.4. Manufacturing Cost Analysis of Aerospace & Defense Elastomers
  12. Chapter 12 Industrial Chain, Sourcing Strategy, and Downstream Buyers
    1. 12.1. Aerospace & Defense Elastomers Industrial Chain Analysis
    2. 12.2. Upstream Raw Materials Sourcing
      1. 12.2.1. Risk Mitigation:
      2. 12.2.2. Supplier Relationships:
      3. 12.2.3. Business Processes:
      4. 12.2.4. Securing the Product:
    3. 12.3. Raw Materials Sources of Aerospace & Defense Elastomers Major Manufacturers
    4. 12.4. Downstream Buyers
    5. 12.5. Distributors/Traders List
  13. Chapter 13 Marketing Strategy Analysis, Distributors
    1. 13.1. Marketing Channel
    2. 13.2. Direct Marketing
    3. 13.3. Indirect Marketing
    4. 13.4. Marketing Channel Development Trends
    5. 13.5. Economic/Political Environmental Change
  14. Chapter 14 Report Conclusion & Key Insights
    1. 14.1. Key Insights from Primary Interviews & Surveys Respondents
    2. 14.2. Key Takeaways from Analysts, Consultants, and Industry Leaders
  15. Chapter 15 Research Approach & Methodology
    1. 15.1. Report Description
    2. 15.2. Research Scope
    3. 15.3. Research Methodology
      1. 15.3.1. Secondary Research
      2. 15.3.2. Primary Research
      3. 15.3.3. Statistical Models
        1. 15.3.3.1. Company Share Analysis Model
        2. 15.3.3.2. Revenue Based Modeling
      4. 15.3.4. Research Limitations 

      List of Figures

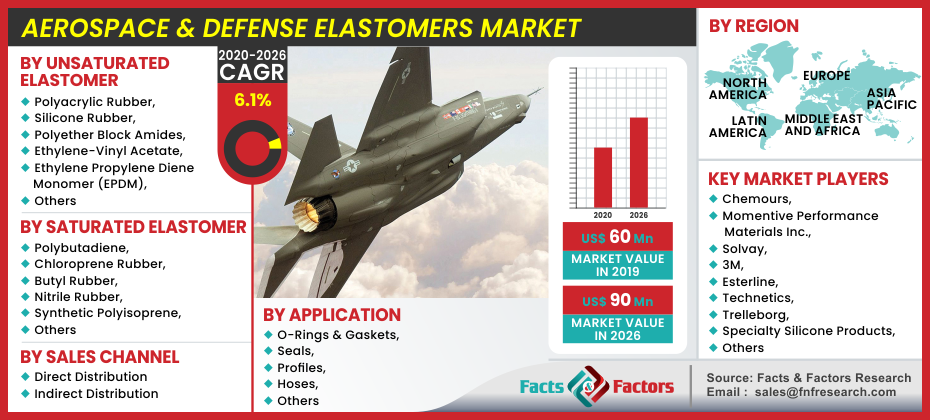
      Fig.1	Product Picture of Aerospace & Defense Elastomers
      Fig.2	Global Aerospace & Defense Elastomers Market, 2016 – 2026 (USD Million)
      Fig.3	Global Aerospace & Defense Elastomers Market, 2016 – 2026 (Kilo Tons)
      Fig.4	Global Aerospace & Defense Elastomers Market Absolute Revenue Opportunity, 2016 – 2026 (USD Million)
      Fig.5	Global Aerospace & Defense Elastomers Market Incremental Revenue Opportunity, 2020 – 2026 (USD Million)
      Fig.6	Global Aerospace & Defense Elastomers Market Share, by Unsaturated Elastomer, 2019 & 2026 (USD Million)
      Fig.7	Global Aerospace & Defense Elastomers Market Share, by Unsaturated Elastomer, 2019 & 2026 (Kilo Tons)
      Fig.8	Global Polyacrylic Rubber Aerospace & Defense Elastomers Market, 2016 – 2026 (USD Million)
      Fig.9	Global Polyacrylic Rubber Aerospace & Defense Elastomers Market, 2016 – 2026 (Kilo Tons)
      Fig.10	Global Silicone Rubber Aerospace & Defense Elastomers Market, 2016 – 2026 (USD Million)
      Fig.11	Global Silicone Rubber Aerospace & Defense Elastomers Market, 2016 – 2026 (Kilo Tons)
      Fig.12	Global Polyether Block Amides Aerospace & Defense Elastomers Market, 2016 – 2026 (USD Million)
      Fig.13	Global Polyether Block Amides Aerospace & Defense Elastomers Market, 2016 – 2026 (Kilo Tons)
      Fig.14	Global Ethylene-Vinyl Acetate Aerospace & Defense Elastomers Market, 2016 – 2026 (USD Million)
      Fig.15	Global Ethylene-Vinyl Acetate Aerospace & Defense Elastomers Market, 2016 – 2026 (Kilo Tons)
      Fig.16	Global Ethylene Propylene Diene Monomer (EPDM) Aerospace & Defense Elastomers Market, 2016 – 2026 (USD Million)
      Fig.17	Global Ethylene Propylene Diene Monomer (EPDM) Aerospace & Defense Elastomers Market, 2016 – 2026 (Kilo Tons)
      Fig.18	Global Others Aerospace & Defense Elastomers Market, 2016 – 2026 (USD Million)
      Fig.19	Global Others Aerospace & Defense Elastomers Market, 2016 – 2026 (Kilo Tons)
      Fig.20	Global Aerospace & Defense Elastomers Market Share, by Saturated Elastomer, 2019 & 2026 (USD Million)
      Fig.21	Global Aerospace & Defense Elastomers Market Share, by Saturated Elastomer, 2019 & 2026 (Kilo Tons)
      Fig.22	Global Polybutadiene Aerospace & Defense Elastomers Market, 2016 – 2026 (USD Million)
      Fig.23	Global Polybutadiene Aerospace & Defense Elastomers Market, 2016 – 2026 (Kilo Tons)
      Fig.24	Global Chloroprene Rubber Aerospace & Defense Elastomers Market, 2016 – 2026 (USD Million)
      Fig.25	Global Chloroprene Rubber Aerospace & Defense Elastomers Market, 2016 – 2026 (Kilo Tons)
      Fig.26	Global Butyl Rubber Aerospace & Defense Elastomers Market, 2016 – 2026 (USD Million)
      Fig.27	Global Butyl Rubber Aerospace & Defense Elastomers Market, 2016 – 2026 (Kilo Tons)
      Fig.28	Global Nitrile Rubber Aerospace & Defense Elastomers Market, 2016 – 2026 (USD Million)
      Fig.29	Global Nitrile Rubber Aerospace & Defense Elastomers Market, 2016 – 2026 (Kilo Tons)
      Fig.30	Global Synthetic Polyisoprene Aerospace & Defense Elastomers Market, 2016 – 2026 (USD Million)
      Fig.31	Global Synthetic Polyisoprene Aerospace & Defense Elastomers Market, 2016 – 2026 (Kilo Tons)
      Fig.32	Global Others Aerospace & Defense Elastomers Market, 2016 – 2026 (USD Million)
      Fig.33	Global Others Aerospace & Defense Elastomers Market, 2016 – 2026 (Kilo Tons)
      Fig.34	Global Aerospace & Defense Elastomers Market Share, by Application, 2019 & 2026 (USD Million)
      Fig.35	Global Aerospace & Defense Elastomers Market Share, by Application, 2019 & 2026 (Kilo Tons)
      Fig.36	Global O-Rings & Gaskets Aerospace & Defense Elastomers Market, 2016 – 2026 (USD Million)
      Fig.37	Global O-Rings & Gaskets Aerospace & Defense Elastomers Market, 2016 – 2026 (Kilo Tons)
      Fig.38	Global Seals Aerospace & Defense Elastomers Market, 2016 – 2026 (USD Million)
      Fig.39	Global Seals Aerospace & Defense Elastomers Market, 2016 – 2026 (Kilo Tons)
      Fig.40	Global Profiles Aerospace & Defense Elastomers Market, 2016 – 2026 (USD Million)
      Fig.41	Global Profiles Aerospace & Defense Elastomers Market, 2016 – 2026 (Kilo Tons)
      Fig.42	Global Hoses Aerospace & Defense Elastomers Market, 2016 – 2026 (USD Million)
      Fig.43	Global Hoses Aerospace & Defense Elastomers Market, 2016 – 2026 (Kilo Tons)
      Fig.44	Global Others Aerospace & Defense Elastomers Market, 2016 – 2026 (USD Million)
      Fig.45	Global Others Aerospace & Defense Elastomers Market, 2016 – 2026 (Kilo Tons)
      Fig.46	Global Aerospace & Defense Elastomers Market Share, by Sales Channel, 2019 & 2026 (USD Million)
      Fig.47	Global Aerospace & Defense Elastomers Market Share, by Sales Channel, 2019 & 2026 (Kilo Tons)
      Fig.48	Global Direct Distribution Aerospace & Defense Elastomers Market, 2016 – 2026 (USD Million)
      Fig.49	Global Direct Distribution Aerospace & Defense Elastomers Market, 2016 – 2026 (Kilo Tons)
      Fig.50	Global Indirect Distribution Aerospace & Defense Elastomers Market, 2016 – 2026 (USD Million)
      Fig.51	Global Indirect Distribution Aerospace & Defense Elastomers Market, 2016 – 2026 (Kilo Tons)
      Fig.52	Global Aerospace & Defense Elastomers Market Share, by Region, 2019 & 2026 (USD Million)
      Fig.53	Global Aerospace & Defense Elastomers Market Share, by Region, 2019 & 2026 (Kilo Tons)
      Fig.54	North America Aerospace & Defense Elastomers Market, 2016 – 2026 (USD Million)
      Fig.55	North America Aerospace & Defense Elastomers Market, 2016 – 2026 (Kilo Tons)
      Fig.56	U.S. Aerospace & Defense Elastomers Market, 2016 – 2026 (USD Million)
      Fig.57	U.S. Aerospace & Defense Elastomers  Market, 2016 – 2026 (Kilo Tons)
      Fig.58	Canada Aerospace & Defense Elastomers Market, 2016 – 2026 (USD Million)
      Fig.59	Canada Aerospace & Defense Elastomers  Market, 2016 – 2026 (Kilo Tons)
      Fig.60	Europe Aerospace & Defense Elastomers Market, 2016 – 2026 (USD Million)
      Fig.61	Europe Aerospace & Defense Elastomers Market, 2016 – 2026 (Kilo Tons)
      Fig.62	Germany Aerospace & Defense Elastomers Market, 2016 – 2026 (USD Million)
      Fig.63	Germany Aerospace & Defense Elastomers  Market, 2016 – 2026 (Kilo Tons)
      Fig.64	France Aerospace & Defense Elastomers Market, 2016 – 2026 (USD Million)
      Fig.65	France Aerospace & Defense Elastomers  Market, 2016 – 2026 (Kilo Tons)
      Fig.66	U.K. Aerospace & Defense Elastomers Market, 2016 – 2026 (USD Million)
      Fig.67	U.K. Aerospace & Defense Elastomers  Market, 2016 – 2026 (Kilo Tons)
      Fig.68	Italy Aerospace & Defense Elastomers Market, 2016 – 2026 (USD Million)
      Fig.69	Italy Aerospace & Defense Elastomers  Market, 2016 – 2026 (Kilo Tons)
      Fig.70	Spain Aerospace & Defense Elastomers Market, 2016 – 2026 (USD Million)
      Fig.71	Spain Aerospace & Defense Elastomers  Market, 2016 – 2026 (Kilo Tons)
      Fig.72	Rest of Europe Aerospace & Defense Elastomers Market, 2016 – 2026 (USD Million)
      Fig.73	Rest of Europe Aerospace & Defense Elastomers  Market, 2016 – 2026 (Kilo Tons)
      Fig.74	Asia Pacific Aerospace & Defense Elastomers Market, 2016 – 2026 (USD Million)
      Fig.75	Asia Pacific Aerospace & Defense Elastomers Market, 2016 – 2026 (Kilo Tons)
      Fig.76	China Aerospace & Defense Elastomers Market, 2016 – 2026 (USD Million)
      Fig.77	China Aerospace & Defense Elastomers  Market, 2016 – 2026 (Kilo Tons)
      Fig.78	Japan Aerospace & Defense Elastomers Market, 2016 – 2026 (USD Million)
      Fig.79	Japan Aerospace & Defense Elastomers  Market, 2016 – 2026 (Kilo Tons)
      Fig.80	India Aerospace & Defense Elastomers Market, 2016 – 2026 (USD Million)
      Fig.81	India Aerospace & Defense Elastomers  Market, 2016 – 2026 (Kilo Tons)
      Fig.82	South  Korea Aerospace & Defense Elastomers Market, 2016 – 2026 (USD Million)
      Fig.83	South  Korea Aerospace & Defense Elastomers  Market, 2016 – 2026 (Kilo Tons)
      Fig.84	South-East Asia Aerospace & Defense Elastomers Market, 2016 – 2026 (USD Million)
      Fig.85	South-East Asia Aerospace & Defense Elastomers  Market, 2016 – 2026 (Kilo Tons)
      Fig.86	Rest of Asia Pacific Aerospace & Defense Elastomers Market, 2016 – 2026 (USD Million)
      Fig.87	Rest of Asia Pacific Aerospace & Defense Elastomers  Market, 2016 – 2026 (Kilo Tons)
      Fig.88	Latin America Aerospace & Defense Elastomers Market, 2016 – 2026 (USD Million)
      Fig.89	Latin America Aerospace & Defense Elastomers Market, 2016 – 2026 (Kilo Tons)
      Fig.90	Brazil Aerospace & Defense Elastomers Market, 2016 – 2026 (USD Million)
      Fig.91	Brazil Aerospace & Defense Elastomers  Market, 2016 – 2026 (Kilo Tons)
      Fig.92	Mexico Aerospace & Defense Elastomers Market, 2016 – 2026 (USD Million)
      Fig.93	Mexico Aerospace & Defense Elastomers  Market, 2016 – 2026 (Kilo Tons)
      Fig.94	Rest of Latin America Aerospace & Defense Elastomers Market, 2016 – 2026 (USD Million)
      Fig.95	Rest of Latin America Aerospace & Defense Elastomers  Market, 2016 – 2026 (Kilo Tons)
      Fig.96	The Middle-East and Africa Aerospace & Defense Elastomers Market, 2016 – 2026 (USD Million)
      Fig.97	The Middle-East and Africa Aerospace & Defense Elastomers Market, 2016 – 2026 (Kilo Tons)
      Fig.98	GCC Countries Aerospace & Defense Elastomers Market, 2016 – 2026 (USD Million)
      Fig.99	GCC Countries Aerospace & Defense Elastomers  Market, 2016 – 2026 (Kilo Tons)
      Fig.100	South Africa Aerospace & Defense Elastomers Market, 2016 – 2026 (USD Million)
      Fig.101	South Africa Aerospace & Defense Elastomers  Market, 2016 – 2026 (Kilo Tons)
      Fig.102	Rest of Middle-East Africa Aerospace & Defense Elastomers Market, 2016 – 2026 (USD Million)
      Fig.103	Rest of Middle-East Africa Aerospace & Defense Elastomers  Market, 2016 – 2026 (Kilo Tons)
      Fig.104	Global Aerospace & Defense Elastomers Production and Consumption, 2016 – 2026 (Kilo Tons)
      Fig.105	North America Aerospace & Defense Elastomers Production and Consumption, 2016 – 2026 (USD Million) (Kilo Tons)
      Fig.106	Europe Aerospace & Defense Elastomers Production and Consumption, 2016 – 2026 (USD Million) (Kilo Tons)
      Fig.107	Asia Pacific Aerospace & Defense Elastomers Production and Consumption, 2016 – 2026 (USD Million) (Kilo Tons)
      Fig.108	Latin America Aerospace & Defense Elastomers Production and Consumption, 2016 – 2026 (USD Million) (Kilo Tons)
      Fig.109	The Middle-East and Africa Aerospace & Defense Elastomers Production and Consumption, 2016 – 2026 (USD Million) (Kilo Tons)
      Fig.110	Competitor Market Share – Revenue
      Fig.111	Competitor Market Share – Volume
      Fig.112	Greene Tweed Revenue and Growth Rate
      Fig.113	Greene Tweed Market Share
      Fig.114	Chemours Revenue and Growth Rate
      Fig.115	Chemours Market Share
      Fig.116	Wacker Chemie AG Revenue and Growth Rate
      Fig.117	Wacker Chemie AG Market Share
      Fig.118	Momentive Performance Materials Inc. Revenue and Growth Rate
      Fig.119	Momentive Performance Materials Inc. Market Share
      Fig.120	Saint-Gobain Revenue and Growth Rate
      Fig.121	Saint-Gobain Market Share
      Fig.122	Solvay Revenue and Growth Rate
      Fig.123	Solvay Market Share
      Fig.124	DOW Corning Revenue and Growth Rate
      Fig.125	DOW Corning Market Share
      Fig.126	3M Revenue and Growth Rate
      Fig.127	3M Market Share
      Fig.128	Chenguang Fluoro & Silicone Elastomers Co., Ltd. Revenue and Growth Rate
      Fig.129	Chenguang Fluoro & Silicone Elastomers Co., Ltd. Market Share
      Fig.130	Esterline Revenue and Growth Rate
      Fig.131	Esterline Market Share
      Fig.132	Holland Shielding Revenue and Growth Rate
      Fig.133	Holland Shielding Market Share
      Fig.134	Technetics Revenue and Growth Rate
      Fig.135	Technetics Market Share
      Fig.136	Lanxess Revenue and Growth Rate
      Fig.137	Lanxess Market Share
      Fig.138	Trelleborg Revenue and Growth Rate
      Fig.139	Trelleborg Market Share
      Fig.140	Specialised Polymer Engineering Revenue and Growth Rate
      Fig.141	Specialised Polymer Engineering Market Share
      Fig.142	Specialty Silicone Products Revenue and Growth Rate
      Fig.143	Specialty Silicone Products Market Share
      Fig.144	Unimatec Revenue and Growth Rate
      Fig.145	Unimatec Market Share
      Fig.146	Zeon Chemicals Revenue and Growth Rate
      Fig.147	Zeon Chemicals Market Share
      Fig.148	Shin-Etsu Chemical Revenue and Growth Rate
      Fig.149	Shin-Etsu Chemical Market Share
      Fig.150	Jonal Laboratories, Inc. Revenue and Growth Rate
      Fig.151	Jonal Laboratories, Inc. Market Share
      Fig.152	Polymod Technologies Revenue and Growth Rate
      Fig.153	Polymod Technologies Market Share
      Fig.154	Quantum Silicones Revenue and Growth Rate
      Fig.155	Quantum Silicones Market Share
      Fig.156	Rogers Corporation Revenue and Growth Rate
      Fig.157	Rogers Corporation Market Share
      Fig.158	TRP Polymer Solutions Limited Revenue and Growth Rate
      Fig.159	TRP Polymer Solutions Limited Market Share
      Fig.160	Seal Science, Inc Revenue and Growth Rate
      Fig.161	Seal Science, Inc Market Share
      Fig.162	Market Dynamics
      Fig.163	Global Aerospace & Defense Elastomers – Value Chain Analysis
      Fig.164	Key Mandates and Regulations
      Fig.165	Technology Roadmap and Timeline
      Fig.166	Market Attractiveness Analysis – By Unsaturated Elastomer
      Fig.167	Market Attractiveness Analysis – By Saturated Elastomer
      Fig.168	Market Attractiveness Analysis – By Application
      Fig.169	Market Attractiveness Analysis – By Sales Channel
      Fig.170	Market Attractiveness Analysis – By Region
      Fig.171	Manufacturing Cost Structure of Aerospace & Defense Elastomers
      Fig.172	Aerospace & Defense Elastomers Industrial Chain Analysis
      Fig.173	Market Channels
      Fig.174	Marketing Channel Development Trend
      Fig.175	Growth in World Gross Product, 2008-2018
      

      List of Tables

      Table 1	Global Aerospace & Defense Elastomers Market, 2019 & 2026 (USD Million)
      Table 2	Global Aerospace & Defense Elastomers Market, by Unsaturated Elastomer, 2016 – 2026 (USD Million)
      Table 3	Global Aerospace & Defense Elastomers Market, by Unsaturated Elastomer, 2016 – 2026 (Kilo Tons)
      Table 4	Global Aerospace & Defense Elastomers Market, by Saturated Elastomer, 2016 – 2026 (USD Million)
      Table 5	Global Aerospace & Defense Elastomers Market, by Saturated Elastomer, 2016 – 2026 (Kilo Tons)
      Table 6	Global Aerospace & Defense Elastomers Market, by Application, 2016 – 2026 (USD Million)
      Table 7	Global Aerospace & Defense Elastomers Market, by Application, 2016 – 2026 (Kilo Tons)
      Table 8	Global Aerospace & Defense Elastomers Market, by Sales Channel, 2016 – 2026 (USD Million)
      Table 9 Global Aerospace & Defense Elastomers Market, by Sales Channel, 2016 – 2026 (Kilo Tons)
      Table 10 Global Aerospace & Defense Elastomers Market, by Region, 2016 – 2026 (USD Million)
      Table 11 Global Aerospace & Defense Elastomers Market, by Region, 2016 – 2026 (Kilo Tons)
      Table 12 North America Aerospace & Defense Elastomers Market, by Country, 2016 – 2026 (USD Million)
      Table 13 North America Aerospace & Defense Elastomers Market, by Country, 2016 – 2026 (Kilo Tons)
      Table 14 North America Aerospace & Defense Elastomers Market, by Unsaturated Elastomer, 2016 – 2026 (USD Million)
      Table 15 North America Aerospace & Defense Elastomers Market, by Unsaturated Elastomer, 2016 – 2026 (Kilo Tons)
      Table 16 North America Aerospace & Defense Elastomers Market, by Saturated Elastomer, 2016 – 2026 (USD Million)
      Table 17 North America Aerospace & Defense Elastomers Market, by Saturated Elastomer, 2016 – 2026 (Kilo Tons)
      Table 18 North America Aerospace & Defense Elastomers Market, by Application, 2016 – 2026 (USD Million)
      Table 19 North America Aerospace & Defense Elastomers Market, by Application, 2016 – 2026 (Kilo Tons)
      Table 20 North America Aerospace & Defense Elastomers Market, by Sales Channel, 2016 – 2026 (USD Million)
      Table 21 North America Aerospace & Defense Elastomers Market, by Sales Channel, 2016 – 2026 (Kilo Tons)
      Table 22 Europe Aerospace & Defense Elastomers Market, by Country, 2016 – 2026 (USD Million)
      Table 23 Europe Aerospace & Defense Elastomers Market, by Country, 2016 – 2026 (Kilo Tons)
      Table 24 Europe Aerospace & Defense Elastomers Market, by Unsaturated Elastomer, 2016 – 2026 (USD Million)
      Table 25 Europe Aerospace & Defense Elastomers Market, by Unsaturated Elastomer, 2016 – 2026 (Kilo Tons)
      Table 26 Europe Aerospace & Defense Elastomers Market, by Saturated Elastomer, 2016 – 2026 (USD Million)
      Table 27 Europe Aerospace & Defense Elastomers Market, by Saturated Elastomer, 2016 – 2026 (Kilo Tons)
      Table 28 Europe Aerospace & Defense Elastomers Market, by Application, 2016 – 2026 (USD Million)
      Table 29 Europe Aerospace & Defense Elastomers Market, by Application, 2016 – 2026 (Kilo Tons)
      Table 30 Europe Aerospace & Defense Elastomers Market, by Sales Channel, 2016 – 2026 (USD Million)
      Table 31 Europe Aerospace & Defense Elastomers Market, by Sales Channel, 2016 – 2026 (Kilo Tons)
      Table 32 Asia Pacific Aerospace & Defense Elastomers Market, by Country, 2016 – 2026 (USD Million)
      Table 33 Asia Pacific Aerospace & Defense Elastomers Market, by Country, 2016 – 2026 (Kilo Tons)
      Table 34 Asia Pacific Aerospace & Defense Elastomers Market, by Unsaturated Elastomer, 2016 – 2026 (USD Million)
      Table 35 Asia Pacific Aerospace & Defense Elastomers Market, by Unsaturated Elastomer, 2016 – 2026 (Kilo Tons)
      Table 36 Asia Pacific Aerospace & Defense Elastomers Market, by Saturated Elastomer, 2016 – 2026 (USD Million)
      Table 37 Asia Pacific Aerospace & Defense Elastomers Market, by Saturated Elastomer, 2016 – 2026 (Kilo Tons)
      Table 38 Asia Pacific Aerospace & Defense Elastomers Market, by Application, 2016 – 2026 (USD Million)
      Table 39 Asia Pacific Aerospace & Defense Elastomers Market, by Application, 2016 – 2026 (Kilo Tons)
      Table 40 Asia Pacific Aerospace & Defense Elastomers Market, by Sales Channel, 2016 – 2026 (USD Million)
      Table 41 Asia Pacific Aerospace & Defense Elastomers Market, by Sales Channel, 2016 – 2026 (Kilo Tons)
      Table 42 Latin America Aerospace & Defense Elastomers Market, by Country, 2016 – 2026 (USD Million)
      Table 43 Latin America Aerospace & Defense Elastomers Market, by Country, 2016 – 2026 (Kilo Tons)
      Table 44 Latin America Aerospace & Defense Elastomers Market, by Unsaturated Elastomer, 2016 – 2026 (USD Million)
      Table 45 Latin America Aerospace & Defense Elastomers Market, by Unsaturated Elastomer, 2016 – 2026 (Kilo Tons)
      Table 46 Latin America Aerospace & Defense Elastomers Market, by Saturated Elastomer, 2016 – 2026 (USD Million)
      Table 47 Latin America Aerospace & Defense Elastomers Market, by Saturated Elastomer, 2016 – 2026 (Kilo Tons)
      Table 48 Latin America Aerospace & Defense Elastomers Market, by Application, 2016 – 2026 (USD Million)
      Table 49 Latin America Aerospace & Defense Elastomers Market, by Application, 2016 – 2026 (Kilo Tons)
      Table 50 Latin America Aerospace & Defense Elastomers Market, by Sales Channel, 2016 – 2026 (USD Million)
      Table 51 Latin America Aerospace & Defense Elastomers Market, by Sales Channel, 2016 – 2026 (Kilo Tons)
      Table 52 The Middle-East and Africa Aerospace & Defense Elastomers Market, by Country, 2016 – 2026 (USD Million)
      Table 53 The Middle-East and Africa Aerospace & Defense Elastomers Market, by Country, 2016 – 2026 (Kilo Tons)
      Table 54 The Middle-East and Africa Aerospace & Defense Elastomers Market, by Unsaturated Elastomer, 2016 – 2026 (USD Million)
      Table 55 The Middle-East and Africa Aerospace & Defense Elastomers Market, by Unsaturated Elastomer, 2016 – 2026 (Kilo Tons)
      Table 56 The Middle-East and Africa Aerospace & Defense Elastomers Market, by Saturated Elastomer, 2016 – 2026 (USD Million)
      Table 57 The Middle-East and Africa Aerospace & Defense Elastomers Market, by Saturated Elastomer, 2016 – 2026 (Kilo Tons)
      Table 58 The Middle-East and Africa Aerospace & Defense Elastomers Market, by Application, 2016 – 2026 (USD Million)
      Table 59 The Middle-East and Africa Aerospace & Defense Elastomers Market, by Application, 2016 – 2026 (Kilo Tons)
      Table 60 The Middle-East and Africa Aerospace & Defense Elastomers Market, by Sales Channel, 2016 – 2026 (USD Million)
      Table 61 The Middle-East and Africa Aerospace & Defense Elastomers Market, by Sales Channel, 2016 – 2026 (Kilo Tons)
      Table 62 North America Aerospace & Defense Elastomers Production, Consumption, Export, Import, 2016 – 2019
      Table 63 Europe Aerospace & Defense Elastomers Production, Consumption, Export, Import, 2016 – 2019
      Table 64 Asia Pacific Aerospace & Defense Elastomers Production, Consumption, Export, Import, 2016 – 2019
      Table 65 Latin America Aerospace & Defense Elastomers Production, Consumption, Export, Import, 2016 – 2019
      Table 66 The Middle-East and Africa Aerospace & Defense Elastomers Production, Consumption, Export, Import, 2016 – 2019
      Table 67 Global Aerospace & Defense Elastomers Market - Company Revenue Analysis, 2016 – 2019 (USD Million)
      Table 68 Global Aerospace & Defense Elastomers Market - Company Revenue Share Analysis, 2016 – 2019 (%)
      Table 69 Global Aerospace & Defense Elastomers Market - Company Volume Analysis, 2016 – 2019 (Kilo Tons)
      Table 70 Global Aerospace & Defense Elastomers Market - Company Volume Share Analysis, 2016 – 2019 (%)
      Table 71 Acquisitions and Mergers
      Table 72 Market Drivers – Impact Analysis
      Table 73 Market Restraints
      Table 74 Market Opportunities
      Table 75 Production Base and Market Concentration Rate of Raw Material
      Table 76 Key Suppliers of Raw Materials
      Table 77 Raw Materials Sources of Aerospace & Defense Elastomers Major Manufacturers
      Table 78 Major Buyers of Aerospace & Defense Elastomers
      Table 79 Distributors/Traders of Aerospace & Defense Elastomers by Region
      

Industry Major Market Players

  • Chemours
  • Momentive Performance Materials Inc.
  • Solvay
  • 3M
  • Esterline
  • Technetics
  • Trelleborg
  • Specialty Silicone Products
  • Zeon Chemicals
  • Jonal Laboratories Inc.
  • Quantum Silicones
  • TRP Polymer Solutions Limited
  • Greene Tweed
  • Wacker Chemie AG
  • Saint-Gobain
  • DOW Corning
  • Chenguang Fluoro & Silicone Elastomers Co. Ltd.
  • Holland Shielding
  • Lanxess
  • Specialised Polymer Engineering
  • Unimatec
  • Shin-Etsu Chemical
  • Polymod Technologies
  • Rogers Corporation
  • Seal Science Inc