Search Market Research Report

Discover Our Latest Reports
Discover Our Featured Reports
Discover Top Selling Reports

Global Agrigenomics Market Size, Share & Growth Industry Report 2026

report img

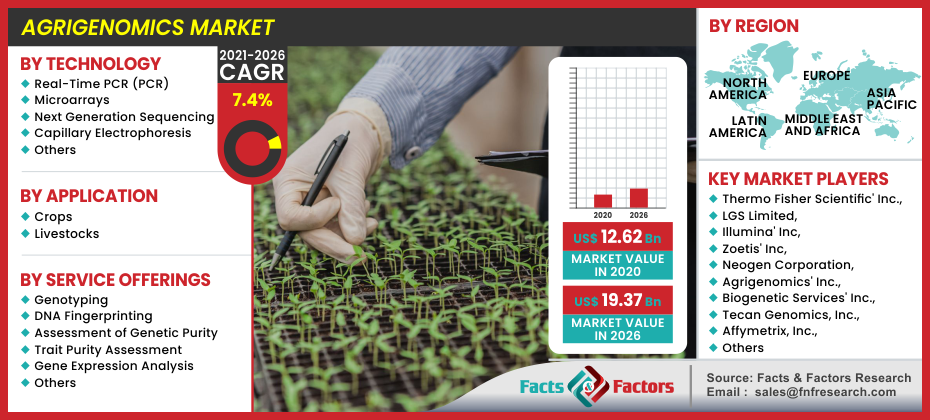
Agrigenomics Market By Technology (Real-Time PCR (PCR), Microarrays, Next Generation Sequencing, Capillary Electrophoresis, Others) By Application (Crops and Livestock), By Service Offerings (Genotyping, DNA Fingerprinting, Assessment of Genetic Purity, Trait Purity Assessment, Gene Expression Analysis, Others), By Region: Global Industry Perspective, Comprehensive Analysis, and Forecast, 2021 – 2026

Industry Insights

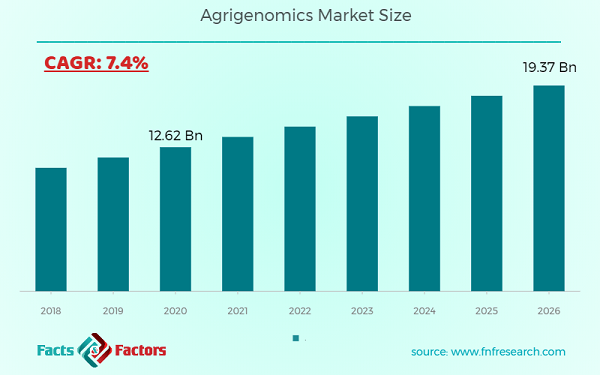
[179+ Pages Report] According to the report published by Facts and Factors, the global agrigenomics market size was valued at around USD12.62 billion in 2020 and is expected to grow to around USD 19.37 billion by 2026 with a compound annual growth rate (CAGR) of roughly 7.4% between 2021 and 2026. The report analyzes the global agrigenomics market drivers, challenges, and the impact they have on the demands during the forecast period. In addition, the report explores emerging opportunities in the agrigenomics market.

Agrigenomics Market Size

To know more about this report | Request Free Sample Copy

logoMarket Overview     

The study of the genetic makeup of crops and livestock, as well as how genes influence production, is known as agrigenomics. The use of genomics in agriculture allows for greater sustainability and productivity in livestock and crop production. Significant technological advancements that have resulted in a shift from single-gene sequencing to whole-genome sequencing, as well as an increase in research on genome formulation and gene function, all contribute to the growth of the agrigenomics market.

The increased use of genetic analysis in livestock not only allows for the analysis of parent lineage but also aids in identifying the behavior of pathogens like viruses and bacteria that infest or live on them. The resolution of the next sequencing allows researchers to examine genetic changes in pathogens over time, which aids in identifying the transmission patterns of these diseases and contributes to the development of effective treatments. Furthermore, these studies allow researchers to control disease outbreaks in livestock, which aids in increasing productivity. These factors are major driving forces in the agrigenomics market.

logoIndustry Growth Factors

The agrigenomics market is expected to expand rapidly during the forecast period, owing to the accelerating increase in population, rise in crop and livestock demand, government policies to support research and development of crop productivity and increase in supply for genomic datasets by the livestock breeders. Technological advancements in sequencer systems, such as the development of high-throughput systems and increased automation, contribute to market growth.

Agrigenomics Market

To know more about this report | Request Free Sample Copy

Furthermore, the decrease in sequencing cost and the reduction in the overall time required for nucleotide sequencing drive market growth. Furthermore, the rising prevalence of sequencing due to the accuracy of results boosts the market. Various research on market-assisted selection and breeding is also expected to drive the market forward. However, high device costs, stringent regulatory procedures, and high investment costs are expected to stifle growth in the agrigenomics market throughout the forecast period.

Additionally, the increasing adoption of various sequencing techniques has resulted in greater accuracy in the results obtained, and ongoing research activities on market-assisted selection and breeding are propelling the Agrigenomics Market forward. Another factor driving the growth of the Agrigenomics Market is the growing presence of the biotechnological industry around the world, as well as government investment in various research projects to boost crop and livestock production

logoSegmentation Analysis

The global Agrigenomics market is segmented based on technology such as Real-Time PCR (PCR), Microarrays, Next Generation Sequencing, Capillary Electrophoresis, and Others.

By application, the market is divided into crops and livestock. It is observed that with the increased demand for GM crops and the research undertaken in the domain, crop application will increase.in the forecast period.

By service offering the market is divided into Genotyping, DNA Fingerprinting, Assessment of Genetic Purity, Trait Purity Assessment, Gene Expression Analysis, and Others. Genotyping is the process of determining differences in an individual's genetic makeup by examining the individual's DNA sequence using biological assays and comparing it to the sequence of another individual or a reference sequence. Identification is the basis for the development in genetic research thus genotyping is likely to be the dominant service offering in the forecast period. The DNA/RNA Sequencing segment is also expected to grow at a faster rate during the forecasted period due to the rising demand for sequencers that can sequence a large number of samples at a low cost.

logo Regional Analysis

The North American agrigenomics market is growing steadily due to the increasing adoption of agrigenomics, which can reduce the use of harmful pesticides by enhancing resistance power during the early stages. The adoption of agrigenomics is primarily attributed to the reduction of pesticide use. Strong R&D, innovation of new technologies, and increased merger and acquisition (M&A) activity are the major factors driving the market growth. With increasing revenue generation within the country, the United States is the largest market in North America, followed by Canada and Mexico. APAC region is also expected to showcase robust growth owing to the high population and the necessity of food security for this population.

logoReport Scope

Report Attribute

Details

Market Size in 2020

USD 12.62 Billion

Projected Market Size in 2026

USD 19.37 Billion

CAGR Growth Rate

7.4% CAGR

Base Year

2020

Forecast Years

2020-2026

Key Market Players

Thermo Fisher Scientific' Inc., LGS Limited, Illumina' Inc, Zoetis' Inc, Neogen Corporation, Agrigenomics' Inc., Biogenetic Services' Inc., Tecan Genomics, Inc., Affymetrix, Inc., Genotypic Technology Pvt Ltd, GalSeq srl, SciGenom Labs Pvt. Ltd, AgriGenome Labs, NuGEN, LGC Biosearch Technologies, Neogen Pharma, and Edico Genome.

Key Segment

By Type, By Product, By End-Use, By Region

Major Regions Covered

North America, Europe, Asia Pacific, Latin America, and the Middle East & Africa

Purchase Options

Request customized purchase options to meet your research needs. Explore purchase options

logo Competitive Players

Major players in the market are

  • Thermo Fisher Scientific' Inc.
  • LGS Limited, Illumina' Inc
  • Zoetis' Inc
  • Neogen Corporation
  • Agrigenomics' Inc.
  • Biogenetic Services' Inc.
  • Tecan Genomics Inc.
  • Affymetrix Inc.
  • Genotypic Technology Pvt Ltd
  • GalSeq srl
  • SciGenom Labs Pvt. Ltd
  • AgriGenome Labs
  • NuGEN
  • LGC Biosearch Technologies
  • Neogen Pharma
  • Edico Genome

The Global Agrigenomics market is segmented as follows:

logoBy Technology

  • Real-Time PCR (PCR)
  • Microarrays
  • Next Generation Sequencing
  • Capillary Electrophoresis
  • Others

logoBy Application

  • Crops
  • Livestocks

logoBy Service Offerings

  • Genotyping
  • DNA Fingerprinting
  • Assessment of Genetic Purity
  • Trait Purity Assessment
  • Gene Expression Analysis
  • Others

logoBy Region

  • North America
    • The U.S.
    • Canada
    • Mexico
  • Europe
    • France
    • The UK
    • Spain
    • Germany
    • Italy
    • Nordic Countries
      • Denmark
      • Sweden
      • Norway
    • Benelux Union
      • Belgium
      • The Netherlands
      • Luxembourg
    • Rest of Europe
  • Asia Pacific
    • China
    • Japan
    • India
    • Australia
    • South Korea
    • Southeast Asia
      • Indonesia
      • Thailand
      • Malaysia
      • Singapore
      • Rest of Southeast Asia
    • Rest of Asia Pacific
  • The Middle East & Africa
    • Saudi Arabia
    • UAE
    • Egypt
    • South Africa
    • Rest of the Middle East & Africa
  • Latin America
    • Brazil
    • Argentina
    • Rest of Latin America

Table of Content

  1. Chapter 1 Executive Summary
    1. 1.1. Introduction of Agrigenomics
    2. 1.2. Global Agrigenomics Market, 2020 & 2026 (USD Billion)
    3. 1.3. Global Agrigenomics Market, 2016 – 2026 (USD Billion)
    4. 1.4. Global Agrigenomics Market Absolute Revenue Opportunity, 2016 – 2026 (USD Billion)
    5. 1.5. Global Agrigenomics Market Incremental Revenue Opportunity, 2020 – 2026 (USD Billion)
  2. Chapter 2 Agrigenomics Market – Technology Analysis
    1. 2.1. Global Agrigenomics Market – Technology Overview
    2. 2.2. Global Agrigenomics Market Share, by Technology, 2020 & 2026 (USD Billion)
    3. 2.3. Real-Time PCR (PCR)
      1. 2.3.1. Global Real-Time PCR (PCR) Agrigenomics Market, 2016 – 2026 (USD Billion)
    4. 2.4. Microarrays
      1. 2.4.1. Global Microarrays Agrigenomics Market, 2016 – 2026 (USD Billion)
    5. 2.5. Next Generation Sequencing
      1. 2.5.1. Global Next Generation Sequencing Agrigenomics Market, 2016 – 2026 (USD Billion)
    6. 2.6. Capillary Electrophoresis
      1. 2.6.1. Global Capillary Electrophoresis Agrigenomics Market, 2016 – 2026 (USD Billion)
    7. 2.7. Others
      1. 2.7.1. Global Others Agrigenomics Market, 2016 – 2026 (USD Billion)
  3. Chapter 3 Agrigenomics Market – Application Analysis
    1. 3.1. Global Agrigenomics Market – Application Overview
    2. 3.2. Global Agrigenomics Market Share, by Application, 2020 & 2026 (USD Billion)
    3. 3.3. Crops
      1. 3.3.1. Global Crops Agrigenomics Market, 2016 – 2026 (USD Billion)
    4. 3.4. Livestocks
      1. 3.4.1. Global Livestocks Agrigenomics Market, 2016 – 2026 (USD Billion)
  4. Chapter 4 Agrigenomics Market – Service Analysis
    1. 4.1. Global Agrigenomics Market – Service Overview
    2. 4.2. Global Agrigenomics Market Share, by Service, 2020 & 2026 (USD Billion)
    3. 4.3. Genotyping
      1. 4.3.1. Global Genotyping Agrigenomics Market, 2016 – 2026 (USD Billion)
    4. 4.4. DNA Fingerprinting
      1. 4.4.1. Global DNA Fingerprinting Agrigenomics Market, 2016 – 2026 (USD Billion)
    5. 4.5. Assessment of Genetic Purity
      1. 4.5.1. Global Assessment of Genetic Purity Agrigenomics Market, 2016 – 2026 (USD Billion)
    6. 4.6. Trait Purity Assessment
      1. 4.6.1. Global Trait Purity Assessment Agrigenomics Market, 2016 – 2026 (USD Billion)
    7. 4.7. Gene Expression Analysis
      1. 4.7.1. Global Gene Expression Analysis Agrigenomics Market, 2016 – 2026 (USD Billion)
    8. 4.8. Others
      1. 4.8.1. Global Others Agrigenomics Market, 2016 – 2026 (USD Billion)
  5. Chapter 5 Agrigenomics Market – Regional Analysis
    1. 5.1. Global Agrigenomics Market Regional Overview
    2. 5.2. Global Agrigenomics Market Share, by Region, 2020 & 2026 (USD Billion)
    3. 5.3. North America
      1. 5.3.1. North America Agrigenomics Market, 2016 – 2026 (USD Billion)
        1. 5.3.1.1. North America Agrigenomics Market, by Country, 2016 - 2026 (USD Billion)
      2. 5.3.2. North America Agrigenomics Market, by Technology, 2016 – 2026
        1. 5.3.2.1. North America Agrigenomics Market, by Technology, 2016 – 2026 (USD Billion)
      3. 5.3.3. North America Agrigenomics Market, by Application, 2016 – 2026
        1. 5.3.3.1. North America Agrigenomics Market, by Application, 2016 – 2026 (USD Billion)
      4. 5.3.4. North America Agrigenomics Market, by Service, 2016 – 2026
        1. 5.3.4.1. North America Agrigenomics Market, by Service, 2016 – 2026 (USD Billion)
      5. 5.3.5. U.S.
        1. 5.3.5.1. U.S. Agrigenomics Market, 2016 – 2026 (USD Billion)
      6. 5.3.6. Canada
        1. 5.3.6.1. Canada Agrigenomics Market, 2016 – 2026 (USD Billion)
    4. 5.4. Europe
      1. 5.4.1. Europe Agrigenomics Market, 2016 – 2026 (USD Billion)
        1. 5.4.1.1. Europe Agrigenomics Market, by Country, 2016 - 2026 (USD Billion)
      2. 5.4.2. Europe Agrigenomics Market, by Technology, 2016 – 2026
        1. 5.4.2.1. Europe Agrigenomics Market, by Technology, 2016 – 2026 (USD Billion)
      3. 5.4.3. Europe Agrigenomics Market, by Application, 2016 – 2026
        1. 5.4.3.1. Europe Agrigenomics Market, by Application, 2016 – 2026 (USD Billion)
      4. 5.4.4. Europe Agrigenomics Market, by Service, 2016 – 2026
        1. 5.4.4.1. Europe Agrigenomics Market, by Service, 2016 – 2026 (USD Billion)
      5. 5.4.5. Germany
        1. 5.4.5.1. Germany Agrigenomics Market, 2016 – 2026 (USD Billion)
      6. 5.4.6. France
        1. 5.4.6.1. France Agrigenomics Market, 2016 – 2026 (USD Billion)
      7. 5.4.7. U.K.
        1. 5.4.7.1. U.K. Agrigenomics Market, 2016 – 2026 (USD Billion)
      8. 5.4.8. Italy
        1. 5.4.8.1. Italy Agrigenomics Market, 2016 – 2026 (USD Billion)
      9. 5.4.9. Spain
        1. 5.4.9.1. Spain Agrigenomics Market, 2016 – 2026 (USD Billion)
      10. 5.4.10. Rest of Europe
        1. 5.4.10.1. Rest of Europe Agrigenomics Market, 2016 – 2026 (USD Billion)
    5. 5.5. Asia Pacific
      1. 5.5.1. Asia Pacific Agrigenomics Market, 2016 – 2026 (USD Billion)
        1. 5.5.1.1. Asia Pacific Agrigenomics Market, by Country, 2016 - 2026 (USD Billion)
      2. 5.5.2. Asia Pacific Agrigenomics Market, by Technology, 2016 – 2026
        1. 5.5.2.1. Asia Pacific Agrigenomics Market, by Technology, 2016 – 2026 (USD Billion)
      3. 5.5.3. Asia Pacific Agrigenomics Market, by Application, 2016 – 2026
        1. 5.5.3.1. Asia Pacific Agrigenomics Market, by Application, 2016 – 2026 (USD Billion)
      4. 5.5.4. Asia Pacific Agrigenomics Market, by Service, 2016 – 2026
        1. 5.5.4.1. Asia Pacific Agrigenomics Market, by Service, 2016 – 2026 (USD Billion)
      5. 5.5.5. China
        1. 5.5.5.1. China Agrigenomics Market, 2016 – 2026 (USD Billion)
      6. 5.5.6. Japan
        1. 5.5.6.1. Japan Agrigenomics Market, 2016 – 2026 (USD Billion)
      7. 5.5.7. India
        1. 5.5.7.1. India Agrigenomics Market, 2016 – 2026 (USD Billion)
      8. 5.5.8. South Korea
        1. 5.5.8.1. South Korea Agrigenomics Market, 2016 – 2026 (USD Billion)
      9. 5.5.9. South-East Asia
        1. 5.5.9.1. South-East Asia Agrigenomics Market, 2016 – 2026 (USD Billion)
      10. 5.5.10. Rest of Asia Pacific
        1. 5.5.10.1. Rest of Asia Pacific Agrigenomics Market, 2016 – 2026 (USD Billion)
    6. 5.6. Latin America
      1. 5.6.1. Latin America Agrigenomics Market, 2016 – 2026 (USD Billion)
        1. 5.6.1.1. Latin America Agrigenomics Market, by Country, 2016 - 2026 (USD Billion)
      2. 5.6.2. Latin America Agrigenomics Market, by Technology, 2016 – 2026
        1. 5.6.2.1. Latin America Agrigenomics Market, by Technology, 2016 – 2026 (USD Billion)
      3. 5.6.3. Latin America Agrigenomics Market, by Application, 2016 – 2026
        1. 5.6.3.1. Latin America Agrigenomics Market, by Application, 2016 – 2026 (USD Billion)
      4. 5.6.4. Latin America Agrigenomics Market, by Service, 2016 – 2026
        1. 5.6.4.1. Latin America Agrigenomics Market, by Service, 2016 – 2026 (USD Billion)
      5. 5.6.5. Brazil
        1. 5.6.5.1. Brazil Agrigenomics Market, 2016 – 2026 (USD Billion)
      6. 5.6.6. Mexico
        1. 5.6.6.1. Mexico Agrigenomics Market, 2016 – 2026 (USD Billion)
      7. 5.6.7. Rest of Latin America
        1. 5.6.7.1. Rest of Latin America Agrigenomics Market, 2016 – 2026 (USD Billion)
    7. 5.7. The Middle-East and Africa
      1. 5.7.1. The Middle-East and Africa Agrigenomics Market, 2016 – 2026 (USD Billion)
        1. 5.7.1.1. The Middle-East and Africa Agrigenomics Market, by Country, 2016 - 2026 (USD Billion)
      2. 5.7.2. The Middle-East and Africa Agrigenomics Market, by Technology, 2016 – 2026
        1. 5.7.2.1. The Middle-East and Africa Agrigenomics Market, by Technology, 2016 – 2026 (USD Billion)
      3. 5.7.3. The Middle-East and Africa Agrigenomics Market, by Application, 2016 – 2026
        1. 5.7.3.1. The Middle-East and Africa Agrigenomics Market, by Application, 2016 – 2026 (USD Billion)
      4. 5.7.4. The Middle-East and Africa Agrigenomics Market, by Service, 2016 – 2026
        1. 5.7.4.1. The Middle-East and Africa Agrigenomics Market, by Service, 2016 – 2026 (USD Billion)
      5. 5.7.5. GCC Countries
        1. 5.7.5.1. GCC Countries Agrigenomics Market, 2016 – 2026 (USD Billion)
      6. 5.7.6. South Africa
        1. 5.7.6.1. South Africa Agrigenomics Market, 2016 – 2026 (USD Billion)
      7. 5.7.7. Rest of Middle-East Africa
        1. 5.7.7.1. Rest of Middle-East Africa Agrigenomics Market, 2016 – 2026 (USD Billion)
  6. Chapter 6 Agrigenomics Market – Competitive Landscape
    1. 6.1. Competitor Market Share – Revenue
    2. 6.2. Market Concentration Rate Analysis, Top 3 and Top 5 Players
    3. 6.3. Strategic Developments
      1. 6.3.1. Acquisitions and Mergers
      2. 6.3.2. New Products
      3. 6.3.3. Research & Development Activities
  7. Chapter 7 Company Profiles
    1. 7.1. Thermo Fisher Scientific' Inc
      1. 7.1.1. Company Overview
      2. 7.1.2. Product/Service Portfolio
      3. 7.1.3. Thermo Fisher Scientific' Inc Sales, Revenue, and Gross Margin
      4. 7.1.4. Thermo Fisher Scientific' Inc Revenue and Growth Rate
      5. 7.1.5. Thermo Fisher Scientific' Inc Market Share
      6. 7.1.6. Recent Initiatives, Funding/VC Activities, and Technological Innovations
    2. 7.2. LGS Limited
      1. 7.2.1. Company Overview
      2. 7.2.2. Product/Service Portfolio
      3. 7.2.3. LGS Limited Sales, Revenue, and Gross Margin
      4. 7.2.4. LGS Limited Revenue and Growth Rate
      5. 7.2.5. LGS Limited Market Share
      6. 7.2.6. Recent Initiatives, Funding/VC Activities, and Technological Innovations
    3. 7.3. Illumina' Inc
      1. 7.3.1. Company Overview
      2. 7.3.2. Product/Service Portfolio
      3. 7.3.3. Illumina' Inc Sales, Revenue, and Gross Margin
      4. 7.3.4. Illumina' Inc Revenue and Growth Rate
      5. 7.3.5. Illumina' Inc Market Share
      6. 7.3.6. Recent Initiatives, Funding/VC Activities, and Technological Innovations
    4. 7.4. Zoetis' Inc
      1. 7.4.1. Company Overview
      2. 7.4.2. Product/Service Portfolio
      3. 7.4.3. Zoetis' Inc Sales, Revenue, and Gross Margin
      4. 7.4.4. Zoetis' Inc Revenue and Growth Rate
      5. 7.4.5. Zoetis' Inc Market Share
      6. 7.4.6. Recent Initiatives, Funding/VC Activities, and Technological Innovations
    5. 7.5. Neogen Corporation
      1. 7.5.1. Company Overview
      2. 7.5.2. Product/Service Portfolio
      3. 7.5.3. Neogen Corporation Sales, Revenue, and Gross Margin
      4. 7.5.4. Neogen Corporation Revenue and Growth Rate
      5. 7.5.5. Neogen Corporation Market Share
      6. 7.5.6. Recent Initiatives, Funding/VC Activities, and Technological Innovations
    6. 7.6. Agrigenomics' Inc
      1. 7.6.1. Company Overview
      2. 7.6.2. Product/Service Portfolio
      3. 7.6.3. Agrigenomics' Inc Sales, Revenue, and Gross Margin
      4. 7.6.4. Agrigenomics' Inc Revenue and Growth Rate
      5. 7.6.5. Agrigenomics' Inc Market Share
      6. 7.6.6. Recent Initiatives, Funding/VC Activities, and Technological Innovations
    7. 7.7. Biogenetic Services' Inc
      1. 7.7.1. Company Overview
      2. 7.7.2. Product/Service Portfolio
      3. 7.7.3. Biogenetic Services' Inc Sales, Revenue, and Gross Margin
      4. 7.7.4. Biogenetic Services' Inc Revenue and Growth Rate
      5. 7.7.5. Biogenetic Services' Inc Market Share
      6. 7.7.6. Recent Initiatives, Funding/VC Activities, and Technological Innovations
    8. 7.8. Tecan Genomics, Inc.,
      1. 7.8.1. Company Overview
      2. 7.8.2. Product/Service Portfolio
      3. 7.8.3. Tecan Genomics, Inc., Sales, Revenue, and Gross Margin
      4. 7.8.4. Tecan Genomics, Inc., Revenue and Growth Rate
      5. 7.8.5. Tecan Genomics, Inc., Market Share
      6. 7.8.6. Recent Initiatives, Funding/VC Activities, and Technological Innovations
    9. 7.9. Affymetrix, Inc
      1. 7.9.1. Company Overview
      2. 7.9.2. Product/Service Portfolio
      3. 7.9.3. Affymetrix, Inc Sales, Revenue, and Gross Margin
      4. 7.9.4. Affymetrix, Inc Revenue and Growth Rate
      5. 7.9.5. Affymetrix, Inc Market Share
      6. 7.9.6. Recent Initiatives, Funding/VC Activities, and Technological Innovations
    10. 7.10. Genotypic Technology Pvt Ltd
      1. 7.10.1. Company Overview
      2. 7.10.2. Product/Service Portfolio
      3. 7.10.3. Genotypic Technology Pvt Ltd Sales, Revenue, and Gross Margin
      4. 7.10.4. Genotypic Technology Pvt Ltd Revenue and Growth Rate
      5. 7.10.5. Genotypic Technology Pvt Ltd Market Share
      6. 7.10.6. Recent Initiatives, Funding/VC Activities, and Technological Innovations
    11. 7.11. GalSeq srl
      1. 7.11.1. Company Overview
      2. 7.11.2. Product/Service Portfolio
      3. 7.11.3. GalSeq srl Sales, Revenue, and Gross Margin
      4. 7.11.4. GalSeq srl Revenue and Growth Rate
      5. 7.11.5. GalSeq srl Market Share
      6. 7.11.6. Recent Initiatives, Funding/VC Activities, and Technological Innovations
    12. 7.12. SciGenom Labs Pvt. Ltd
      1. 7.12.1. Company Overview
      2. 7.12.2. Product/Service Portfolio
      3. 7.12.3. SciGenom Labs Pvt. Ltd Sales, Revenue, and Gross Margin
      4. 7.12.4. SciGenom Labs Pvt. Ltd Revenue and Growth Rate
      5. 7.12.5. SciGenom Labs Pvt. Ltd Market Share
      6. 7.12.6. Recent Initiatives, Funding/VC Activities, and Technological Innovations
    13. 7.13. AgriGenome Labs
      1. 7.13.1. Company Overview
      2. 7.13.2. Product/Service Portfolio
      3. 7.13.3. AgriGenome Labs Sales, Revenue, and Gross Margin
      4. 7.13.4. AgriGenome Labs Revenue and Growth Rate
      5. 7.13.5. AgriGenome Labs Market Share
      6. 7.13.6. Recent Initiatives, Funding/VC Activities, and Technological Innovations
    14. 7.14. NuGEN
      1. 7.14.1. Company Overview
      2. 7.14.2. Product/Service Portfolio
      3. 7.14.3. NuGEN Sales, Revenue, and Gross Margin
      4. 7.14.4. NuGEN Revenue and Growth Rate
      5. 7.14.5. NuGEN Market Share
      6. 7.14.6. Recent Initiatives, Funding/VC Activities, and Technological Innovations
    15. 7.15. LGC Biosearch Technologies
      1. 7.15.1. Company Overview
      2. 7.15.2. Product/Service Portfolio
      3. 7.15.3. LGC Biosearch Technologies Sales, Revenue, and Gross Margin
      4. 7.15.4. LGC Biosearch Technologies Revenue and Growth Rate
      5. 7.15.5. LGC Biosearch Technologies Market Share
      6. 7.15.6. Recent Initiatives, Funding/VC Activities, and Technological Innovations
    16. 7.16. Neogen Pharma
      1. 7.16.1. Company Overview
      2. 7.16.2. Product/Service Portfolio
      3. 7.16.3. Neogen Pharma Sales, Revenue, and Gross Margin
      4. 7.16.4. Neogen Pharma Revenue and Growth Rate
      5. 7.16.5. Neogen Pharma Market Share
      6. 7.16.6. Recent Initiatives, Funding/VC Activities, and Technological Innovations
    17. 7.17. Edico Genome
      1. 7.17.1. Company Overview
      2. 7.17.2. Product/Service Portfolio
      3. 7.17.3. Edico Genome Sales, Revenue, and Gross Margin
      4. 7.17.4. Edico Genome Revenue and Growth Rate
      5. 7.17.5. Edico Genome Market Share
      6. 7.17.6. Recent Initiatives, Funding/VC Activities, and Technological Innovations
  8. Chapter 8 Agrigenomics — Industry Analysis
    1. 8.1. Introduction and Taxonomy
    2. 8.2. Agrigenomics Market – Key Trends
      1. 8.2.1. Market Drivers
      2. 8.2.2. Market Restraints
      3. 8.2.3. Market Opportunities
    3. 8.3. Value Chain Analysis
    4. 8.4. Key Mandates and Regulations
    5. 8.5. Technology Roadmap and Timeline
    6. 8.6. Agrigenomics Market – Attractiveness Analysis
      1. 8.6.1. By Technology
      2. 8.6.2. By Application
      3. 8.6.3. By Service
      4. 8.6.4. By Region
  9. Chapter 9 Industrial Chain, Sourcing Strategy, and Downstream Buyers
    1. 9.1. Agrigenomics Industrial Chain Analysis
    2. 9.2. Downstream Buyers
    3. 9.3. Distributors/Traders List
  10. Chapter 10 Marketing Strategy Analysis
    1. 10.1. Marketing Channel
    2. 10.2. Direct Marketing
    3. 10.3. Indirect Marketing
    4. 10.4. Marketing Channel Development Trends
    5. 10.5. Economic/Political Environmental Change
  11. Chapter 11 Report Conclusion & Key Insights
    1. 11.1. Key Insights from Primary Interviews & Surveys Respondents
    2. 11.2. Key Takeaways from Analysts, Consultants, and Industry Leaders
  12. Chapter 12 Research Approach & Methodology
    1. 12.1. Report Description
    2. 12.2. Research Scope
    3. 12.3. Research Methodology
      1. 12.3.1. Secondary Research
      2. 12.3.2. Primary Research
      3. 12.3.3. Statistical Models
        1. 12.3.3.1. Company Share Analysis Model
        2. 12.3.3.2. Revenue Based Modeling
      4. 12.3.4. Research Limitations

  • List of Figures

    Fig.1	Product Picture of Agrigenomics
    Fig.2	Global Agrigenomics Market, 2016 – 2026 (USD Billion)
    Fig.3	Global Agrigenomics Market Absolute Revenue Opportunity, 2016 – 2026 (USD Billion)
    Fig.4	Global Agrigenomics Market Incremental Revenue Opportunity, 2020 – 2026 (USD Billion)
    Fig.5	Global Agrigenomics Market Share, by Technology, 2020 & 2026 (USD Billion)
    Fig.6	Global  Real-Time PCR (PCR) Agrigenomics Market, 2016 – 2026 (USD Billion)
    Fig.7	Global Microarrays Agrigenomics Market, 2016 – 2026 (USD Billion)
    Fig.8	Global Next Generation Sequencing Agrigenomics Market, 2016 – 2026 (USD Billion)
    Fig.9	Global Capillary Electrophoresis Agrigenomics Market, 2016 – 2026 (USD Billion)
    Fig.10	Global Others Agrigenomics Market, 2016 – 2026 (USD Billion)
    Fig.11	Global Agrigenomics Market Share, by  Application, 2020 & 2026 (USD Billion)
    Fig.12	Global Crops Agrigenomics Market, 2016 – 2026 (USD Billion)
    Fig.13	Global Livestocks Agrigenomics Market, 2016 – 2026 (USD Billion)
    Fig.14	Global Agrigenomics Market Share, by Service, 2020 & 2026 (USD Billion)
    Fig.15	Global Genotyping Agrigenomics Market, 2016 – 2026 (USD Billion)
    Fig.16	Global DNA Fingerprinting Agrigenomics Market, 2016 – 2026 (USD Billion)
    Fig.17	Global Assessment of Genetic Purity Agrigenomics Market, 2016 – 2026 (USD Billion)
    Fig.18	Global Trait Purity Assessment Agrigenomics Market, 2016 – 2026 (USD Billion)
    Fig.19	Global Gene Expression Analysis Agrigenomics Market, 2016 – 2026 (USD Billion)
    Fig.20	Global Others Agrigenomics Market, 2016 – 2026 (USD Billion)
    Fig.21	Global Agrigenomics Market Share, by Region, 2020 & 2026 (USD Billion)
    Fig.22	North America Agrigenomics Market, 2016 – 2026 (USD Billion)
    Fig.23	U.S. Agrigenomics Market, 2016 – 2026 (USD Billion)
    Fig.24	Canada Agrigenomics Market, 2016 – 2026 (USD Billion)
    Fig.25	Europe Agrigenomics Market, 2016 – 2026 (USD Billion)
    Fig.26	Germany Agrigenomics Market, 2016 – 2026 (USD Billion)
    Fig.27	France Agrigenomics Market, 2016 – 2026 (USD Billion)
    Fig.28	U.K. Agrigenomics Market, 2016 – 2026 (USD Billion)
    Fig.29	Italy Agrigenomics Market, 2016 – 2026 (USD Billion)
    Fig.30	Spain Agrigenomics Market, 2016 – 2026 (USD Billion)
    Fig.31	Rest of Europe Agrigenomics Market, 2016 – 2026 (USD Billion)
    Fig.32	Asia Pacific Agrigenomics Market, 2016 – 2026 (USD Billion)
    Fig.33	China Agrigenomics Market, 2016 – 2026 (USD Billion)
    Fig.34	Japan Agrigenomics Market, 2016 – 2026 (USD Billion)
    Fig.35	India Agrigenomics Market, 2016 – 2026 (USD Billion)
    Fig.36	South  Korea Agrigenomics Market, 2016 – 2026 (USD Billion)
    Fig.37	South-East Asia Agrigenomics Market, 2016 – 2026 (USD Billion)
    Fig.38	Rest of Asia Pacific Agrigenomics Market, 2016 – 2026 (USD Billion)
    Fig.39	Latin America Agrigenomics Market, 2016 – 2026 (USD Billion)
    Fig.40	Brazil Agrigenomics Market, 2016 – 2026 (USD Billion)
    Fig.41	Mexico Agrigenomics Market, 2016 – 2026 (USD Billion)
    Fig.42	Rest of Latin America Agrigenomics Market, 2016 – 2026 (USD Billion)
    Fig.43	The Middle-East and Africa Agrigenomics Market, 2016 – 2026 (USD Billion)
    Fig.44	GCC Countries Agrigenomics Market, 2016 – 2026 (USD Billion)
    Fig.45	South Africa Agrigenomics Market, 2016 – 2026 (USD Billion)
    Fig.46	Rest of Middle-East Africa Agrigenomics Market, 2016 – 2026 (USD Billion)
    Fig.47	Competitor Market Share – Revenue
    Fig.48	Thermo Fisher Scientific' Inc Revenue and Growth Rate
    Fig.49	Thermo Fisher Scientific' Inc Market Share
    Fig.50	LGS Limited Revenue and Growth Rate
    Fig.51	LGS Limited Market Share
    Fig.52	Illumina' Inc Revenue and Growth Rate
    Fig.53	Illumina' Inc Market Share
    Fig.54	Zoetis' Inc Revenue and Growth Rate
    Fig.55	Zoetis' Inc Market Share
    Fig.56	Neogen Corporation Revenue and Growth Rate
    Fig.57	Neogen Corporation Market Share
    Fig.58	Agrigenomics' Inc Revenue and Growth Rate
    Fig.59	Agrigenomics' Inc Market Share
    Fig.60	Biogenetic Services' Inc Revenue and Growth Rate
    Fig.61	Biogenetic Services' Inc Market Share
    Fig.62	Tecan Genomics, Inc., Revenue and Growth Rate
    Fig.63	Tecan Genomics, Inc., Market Share
    Fig.64	Affymetrix, Inc Revenue and Growth Rate
    Fig.65	Affymetrix, Inc Market Share
    Fig.66	Genotypic Technology Pvt Ltd Revenue and Growth Rate
    Fig.67	Genotypic Technology Pvt Ltd Market Share
    Fig.68	GalSeq srl Revenue and Growth Rate
    Fig.69	GalSeq srl Market Share
    Fig.70	SciGenom Labs Pvt. Ltd Revenue and Growth Rate
    Fig.71	SciGenom Labs Pvt. Ltd Market Share
    Fig.72	AgriGenome Labs Revenue and Growth Rate
    Fig.73	AgriGenome Labs Market Share
    Fig.74	NuGEN Revenue and Growth Rate
    Fig.75	NuGEN Market Share
    Fig.76	LGC Biosearch Technologies Revenue and Growth Rate
    Fig.77	LGC Biosearch Technologies Market Share
    Fig.78	Neogen Pharma Revenue and Growth Rate
    Fig.79	Neogen Pharma Market Share
    Fig.80	Edico Genome Revenue and Growth Rate
    Fig.81	Edico Genome Market Share
    Fig.82	Market Dynamics
    Fig.83	Global Agrigenomics – Value Chain Analysis
    Fig.84	Key Mandates and Regulations
    Fig.85	Technology Roadmap and Timeline
    Fig.86	Market Attractiveness Analysis – By Technology
    Fig.87	Market Attractiveness Analysis – By  Application
    Fig.88	Market Attractiveness Analysis – By Service
    Fig.89	Market Attractiveness Analysis – By Region
    Fig.90	Agrigenomics Industrial Chain Analysis
    Fig.91	Market Channels
    Fig.92	Marketing Channel Development Trend
    Fig.93	Growth in World Gross Product, 2008-2018
    

    List of Tables

    Table 1	Global Agrigenomics Market, 2020 & 2026 (USD Billion)
    Table 2	Global Agrigenomics Market, by Technology, 2016 – 2026 (USD Billion)
    Table 3	Global Agrigenomics Market, by  Application, 2016 – 2026 (USD Billion)
    Table 4	Global Agrigenomics Market, by Service, 2016 – 2026 (USD Billion)
    Table 5	Global Agrigenomics Market, by Region, 2016 – 2026 (USD Billion)
    Table 6	North America Agrigenomics Market, by Country, 2016 – 2026 (USD Billion)
    Table 7	North America Agrigenomics Market, by Technology, 2016 – 2026 (USD Billion)
    Table 8	North America Agrigenomics Market, by  Application, 2016 – 2026 (USD Billion)
    Table 9 North America Agrigenomics Market, by Service, 2016 – 2026 (USD Billion)
    Table 10 Europe Agrigenomics Market, by Country, 2016 – 2026 (USD Billion)
    Table 11 Europe Agrigenomics Market, by Technology, 2016 – 2026 (USD Billion)
    Table 12 Europe Agrigenomics Market, by  Application, 2016 – 2026 (USD Billion)
    Table 13 Europe Agrigenomics Market, by Service, 2016 – 2026 (USD Billion)
    Table 14 Asia Pacific Agrigenomics Market, by Country, 2016 – 2026 (USD Billion)
    Table 15 Asia Pacific Agrigenomics Market, by Technology, 2016 – 2026 (USD Billion)
    Table 16 Asia Pacific Agrigenomics Market, by  Application, 2016 – 2026 (USD Billion)
    Table 17 Asia Pacific Agrigenomics Market, by Service, 2016 – 2026 (USD Billion)
    Table 18 Latin America Agrigenomics Market, by Country, 2016 – 2026 (USD Billion)
    Table 19 Latin America Agrigenomics Market, by Technology, 2016 – 2026 (USD Billion)
    Table 20 Latin America Agrigenomics Market, by  Application, 2016 – 2026 (USD Billion)
    Table 21 Latin America Agrigenomics Market, by Service, 2016 – 2026 (USD Billion)
    Table 22 The Middle-East and Africa Agrigenomics Market, by Country, 2016 – 2026 (USD Billion)
    Table 23 The Middle-East and Africa Agrigenomics Market, by Technology, 2016 – 2026 (USD Billion)
    Table 24 The Middle-East and Africa Agrigenomics Market, by  Application, 2016 – 2026 (USD Billion)
    Table 25 The Middle-East and Africa Agrigenomics Market, by Service, 2016 – 2026 (USD Billion)
    Table 26 Global Agrigenomics Market - Company Revenue Analysis, 2016 – 2020 (USD Billion)
    Table 27 Global Agrigenomics Market - Company Revenue Share Analysis, 2016 – 2020 (%)
    Table 28 Acquisitions and Mergers
    Table 29 Market Drivers – Impact Analysis
    Table 30 Market Restraints
    Table 31 Market Opportunities
    Table 32 Major Buyers of Agrigenomics
    Table 33 Distributors/Traders of Agrigenomics by Region
    
  •  

    Industry Major Market Players

    • Thermo Fisher Scientific' Inc.
    • LGS Limited, Illumina' Inc
    • Zoetis' Inc
    • Neogen Corporation
    • Agrigenomics' Inc.
    • Biogenetic Services' Inc.
    • Tecan Genomics Inc.
    • Affymetrix Inc.
    • Genotypic Technology Pvt Ltd
    • GalSeq srl
    • SciGenom Labs Pvt. Ltd
    • AgriGenome Labs
    • NuGEN
    • LGC Biosearch Technologies
    • Neogen Pharma
    • Edico Genome