Search Market Research Report

Discover Our Latest Reports
Discover Our Featured Reports
Discover Top Selling Reports

Hoverboards Market Size, Share Global Analysis Report, 2021 – 2026

report img

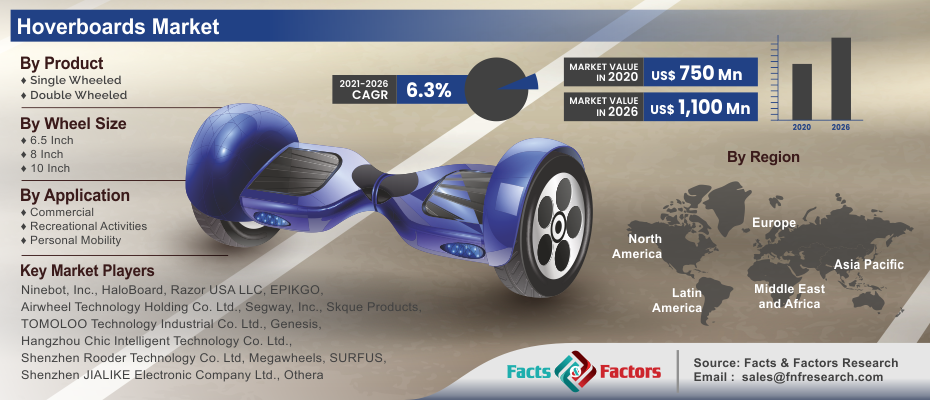
Hoverboards Market: By Product (Single Wheeled and Double Wheeled), By Wheel Size (6.5 Inch, 8 Inch, and 10 Inch), By Application (Commercial, Recreational Activities, and Personal Mobility), By Distribution Channel (Online and Offline), And By Regions – Global & Regional Industry Perspective, Comprehensive Analysis, and Forecast 2021 – 2026

Industry Insights

According to Facts & Factors, the global hoverboards market report is a reflection of all the quantitative as well as qualitative market data. In this report, the market witnessed a value of USD 750 Million in 2020 and with growth at a CAGR of 6.3% is expected to reach a value of USD 1,100 Million by 2026.

logoMarket Overview

A hoverboard is a gadget that is self-balancing and battery operated. It is basically used for personal transportation. There are few hoverboards designed for high performance such as electric skateboards or electric scooters. This gadget has two parallelly aligned wheels that are attached using tiny electronic panel. The hoverboard moves when the user stands on the panel and uses his or her body weight to maneuver. It is assumed that hoverboards could be the next eco-friendly vehicles that can turn traveling into complete entertainment. This micro-mobility vehicle is soon going to become popular owing to the growing demand for hi-tech and fuel-efficient vehicles among generation Z.

logoIndustry Growth Factors

The growing interest of the manufacturers in investing in power-efficient and technologies, such as LED lights, Bluetooth, is projected to increase the demand for the hoverboards market over the forecast period. Furthermore, the rapid urbanization and high disposable income coupled with the rising demand for hi-tech gadgets are expected to boost the global hoverboards market. The latest green mobility trend, low cost of batteries, and rising fuel prices further bolster the demand for hoverboards across the globe.

The growing popularity of this product among the kids and commercial sector are other factors likely to fuel the market growth over the forecast period. most importantly, the cost-effectiveness and lightweight of the hoverboard make it even more prevalent. The installation of safer technologies and better designing of hoverboards is projected to enhance its branding over the years. One of the attractive features of the hoverboards is its zero emission machines meaning it is an eco-friendly commute which makes it a demanding product. However, the battery related issues such as explosions and safety concerns will restrain the market growth.

The lack of awareness about hoverboards in the underdeveloped or developing regions coupled with low disposable income will hinder the market growth in the near future.

Hoverboards Market

To know more about this report | Request Free Sample Copy

logoSegmentation Analysis

The global hoverboards market is segmented based on the product, wheel size, application, distribution channel, and regions.

By product, the global hoverboards market is divided into single wheeled and double wheeled. In the hoverboards market, the double wheeled segment is expected to dominate the market over the forecast period. The growth is probably due to the easy availability and fine riding convenience of the users even on rough terrains. Based on wheel size, the hoverboards market is fragmented into 6.5 Inch, 8 Inch, and 10 Inch.

The 6.5 Inch segment is expected to account for the highest market share as the popularity of these sizes among the children for their indoor activity is on the rise across the globe. On the basis of application, the global hoverboards market is categorized into commercial, recreational activities, and personal mobility. From all these, the commercial segment holds the largest market share. Growing demand for hoverboards among the security personnel is projected to enhance its demand. Furthermore, the rising use of these gadgets in colleges, shopping malls, and manufacturing units also has a positive influence on the market. By distribution channel, the market is classified into online and offline.

logo Report Scope

Report Attribute

Details

Market Size in 2020

USD 750 Million

Projected Market Size in 2026

USD 1,100 Million

CAGR Growth Rate

6.3% CAGR

Base Year

2020

Forecast Years

2021-2026

Key Market Players

Ninebot, Inc., HaloBoard, Razor USA LLC, EPIKGO, Airwheel Technology Holding Co. Ltd., Segway, Inc., Skque Products, TOMOLOO Technology Industrial Co. Ltd., Genesis, Hangzhou Chic Intelligent Technology Co. Ltd., Shenzhen Rooder Technology Co. Ltd, Megawheels, SURFUS, Shenzhen JIALIKE Electronic Company Ltd., and Shenzhen Uwheel Technology Co. Ltd., among others.

Key Segment

By Product, By Wheel Size, By Application, By Distribution Channel, and By Region

Major Regions Covered

North America, Europe, Asia Pacific, Latin America, and Middle East & Africa

Purchase Options

Request customized purchase options to meet your research needs. Explore purchase options

logo Regional Analysis

The Asia Pacific is expected to grow at a significant rate owing to the rising demand for hoverboards in regions including China, Malaysia, etc. China is one of the leading manufacturers of hoverboards which will further help the Asia Pacific region grow at a rapid rate over the forecast period. On the other hand, North America is expected to rank second in terms of growth owing to the rising popularity of the hoverboard for personal commute and also the growing popularity among the kids and youngsters.

logo Competitive Players

Some of the key players dominating the global hoverboards market include :

  • Ninebot Inc.
  • HaloBoard
  • Razor USA LLC
  • EPIKGO
  • Airwheel Technology Holding Co. Ltd.
  • Segway Inc.
  • Skque Products
  • TOMOLOO Technology Industrial Co. Ltd.
  • Genesis
  • Hangzhou Chic Intelligent Technology Co. Ltd.
  • Shenzhen Rooder Technology Co. Ltd
  • Megawheels
  • SURFUS
  • Shenzhen JIALIKE Electronic Company Ltd.
  • Shenzhen Uwheel Technology Co. Ltd.

logo By Product Segment Analysis

  • Single Wheeled
  • Double Wheeled

logo By Wheel Size Segment Analysis

  • 6.5 Inch
  • 8 Inch
  • 10 Inch

logo By Application Segment Analysis

  • Commercial
  • Recreational Activities
  • Personal Mobility

logo By Regional Segment Analysis

  • North America
    • U.S.
    • Canada
  • Europe
    • UK
    • France
    • Germany
    • Italy
    • Spain
    • Rest of Europe
  • Asia Pacific
    • China
    • Japan
    • India
    • South Korea
    • Southeast Asia
    • Rest of Asia Pacific
  • Latin America
    • Brazil
    • Mexico
    • Rest of Latin America
  • Middle East and Africa
    • GCC Countries
    • South Africa
    • Rest of MEA

Table of Content

  1. Chapter 1 Executive Summary
    1. 1.1. Introduction of Hoverboards
    2. 1.2. Global Hoverboards Market, 2019 & 2026 (USD Million)
    3. 1.3. Global Hoverboards Market, 2016 – 2026 (USD Million)
    4. 1.4. Global Hoverboards Market Absolute Revenue Opportunity, 2016 – 2026 (USD Million)
    5. 1.5. Global Hoverboards Market Incremental Revenue Opportunity, 2020 – 2026 (USD Million)
  2. Chapter 2 Hoverboards Market – Product Analysis
    1. 2.1. Global Hoverboards Market – Product Overview
    2. 2.2. Global Hoverboards Market Share, by Product, 2019 & 2026 (USD Million)
    3. 2.3. Single Wheeled
      1. 2.3.1. Global Single Wheeled Hoverboards Market, 2016 – 2026 (USD Million)
    4. 2.4. Double Wheeled
      1. 2.4.1. Global Double Wheeled Hoverboards Market, 2016 – 2026 (USD Million)
  3. Chapter 3 Hoverboards Market – Wheel Size Analysis
    1. 3.1. Global Hoverboards Market – Wheel Size Overview
    2. 3.2. Global Hoverboards Market Share, by Wheel Size, 2019 & 2026 (USD Million)
      1. 3.3. 6.5 Inch
      2. 3.3.1. Global 6.5 Inch Hoverboards Market, 2016 – 2026 (USD Million)
    3. 3.4. 8 Inch
      1. 3.4.1. Global 8 Inch Hoverboards Market, 2016 – 2026 (USD Million)
    4. 3.5. 10 Inch
      1. 3.5.1. Global 10 Inch Hoverboards Market, 2016 – 2026 (USD Million)
  4. Chapter 4 Hoverboards Market – Application Analysis
    1. 4.1. Global Hoverboards Market – Application Overview
    2. 4.2. Global Hoverboards Market Share, by Application, 2019 & 2026 (USD Million)
    3. 4.3. Commercial
      1. 4.3.1. Global Commercial Hoverboards Market, 2016 – 2026 (USD Million)
    4. 4.4. Recreational Activities
      1. 4.4.1. Global Recreational Activities Hoverboards Market, 2016 – 2026 (USD Million)
    5. 4.5. Personal Mobility
      1. 4.5.1. Global Personal Mobility Hoverboards Market, 2016 – 2026 (USD Million)
  5. Chapter 5 Hoverboards Market – Distribution Channel Analysis
    1. 5.1. Global Hoverboards Market – Distribution Channel Overview
    2. 5.2. Global Hoverboards Market Share, by Distribution Channel, 2019 & 2026 (USD Million)
    3. 5.3. Online
      1. 5.3.1. Global Online Hoverboards Market, 2016 – 2026 (USD Million)
    4. 5.4. Offline
      1. 5.4.1. Global Offline Hoverboards Market, 2016 – 2026 (USD Million)
  6. Chapter 6 Hoverboards Market – Regional Analysis
    1. 6.1. Global Hoverboards Market Regional Overview
    2. 6.2. Global Hoverboards Market Share, by Region, 2019 & 2026 (USD Million)
    3. 6.3. North America
      1. 6.3.1. North America Hoverboards Market, 2016 – 2026 (USD Million)
        1. 6.3.1.1. North America Hoverboards Market, by Country, 2016 - 2026 (USD Million)
      2. 6.3.2. North America Hoverboards Market, by Product, 2016 – 2026
        1. 6.3.2.1. North America Hoverboards Market, by Product, 2016 – 2026 (USD Million)
      3. 6.3.3. North America Hoverboards Market, by Wheel Size, 2016 – 2026
        1. 6.3.3.1. North America Hoverboards Market, by Wheel Size, 2016 – 2026 (USD Million)
      4. 6.3.4. North America Hoverboards Market, by Application, 2016 – 2026
        1. 6.3.4.1. North America Hoverboards Market, by Application, 2016 – 2026 (USD Million)
      5. 6.3.5. North America Hoverboards Market, by Distribution Channel, 2016 – 2026
        1. 6.3.5.1. North America Hoverboards Market, by Distribution Channel, 2016 – 2026 (USD Million)
      6. 6.3.6. U.S.
        1. 6.3.6.1. U.S. Hoverboards Market, 2016 – 2026 (USD Million)
      7. 6.3.7. Canada
        1. 6.3.7.1. Canada Hoverboards Market, 2016 – 2026 (USD Million)
    4. 6.4. Europe
      1. 6.4.1. Europe Hoverboards Market, 2016 – 2026 (USD Million)
        1. 6.4.1.1. Europe Hoverboards Market, by Country, 2016 - 2026 (USD Million)
      2. 6.4.2. Europe Hoverboards Market, by Product, 2016 – 2026
        1. 6.4.2.1. Europe Hoverboards Market, by Product, 2016 – 2026 (USD Million)
      3. 6.4.3. Europe Hoverboards Market, by Wheel Size, 2016 – 2026
        1. 6.4.3.1. Europe Hoverboards Market, by Wheel Size, 2016 – 2026 (USD Million)
      4. 6.4.4. Europe Hoverboards Market, by Application, 2016 – 2026
        1. 6.4.4.1. Europe Hoverboards Market, by Application, 2016 – 2026 (USD Million)
      5. 6.4.5. Europe Hoverboards Market, by Distribution Channel, 2016 – 2026
        1. 6.4.5.1. Europe Hoverboards Market, by Distribution Channel, 2016 – 2026 (USD Million)
      6. 6.4.6. Germany
        1. 6.4.6.1. Germany Hoverboards Market, 2016 – 2026 (USD Million)
      7. 6.4.7. France
        1. 6.4.7.1. France Hoverboards Market, 2016 – 2026 (USD Million)
      8. 6.4.8. U.K.
        1. 6.4.8.1. U.K. Hoverboards Market, 2016 – 2026 (USD Million)
      9. 6.4.9. Italy
        1. 6.4.9.1. Italy Hoverboards Market, 2016 – 2026 (USD Million)
      10. 6.4.10. Spain
        1. 6.4.10.1. Spain Hoverboards Market, 2016 – 2026 (USD Million)
      11. 6.4.11. Rest of Europe
        1. 6.4.11.1. Rest of Europe Hoverboards Market, 2016 – 2026 (USD Million)
    5. 6.5. Asia Pacific
      1. 6.5.1. Asia Pacific Hoverboards Market, 2016 – 2026 (USD Million)
        1. 6.5.1.1. Asia Pacific Hoverboards Market, by Country, 2016 - 2026 (USD Million)
      2. 6.5.2. Asia Pacific Hoverboards Market, by Product, 2016 – 2026
        1. 6.5.2.1. Asia Pacific Hoverboards Market, by Product, 2016 – 2026 (USD Million)
      3. 6.5.3. Asia Pacific Hoverboards Market, by Wheel Size, 2016 – 2026
        1. 6.5.3.1. Asia Pacific Hoverboards Market, by Wheel Size, 2016 – 2026 (USD Million)
      4. 6.5.4. Asia Pacific Hoverboards Market, by Application, 2016 – 2026
        1. 6.5.4.1. Asia Pacific Hoverboards Market, by Application, 2016 – 2026 (USD Million)
      5. 6.5.5. Asia Pacific Hoverboards Market, by Distribution Channel, 2016 – 2026
        1. 6.5.5.1. Asia Pacific Hoverboards Market, by Distribution Channel, 2016 – 2026 (USD Million)
      6. 6.5.6. China
        1. 6.5.6.1. China Hoverboards Market, 2016 – 2026 (USD Million)
      7. 6.5.7. Japan
        1. 6.5.7.1. Japan Hoverboards Market, 2016 – 2026 (USD Million)
      8. 6.5.8. India
        1. 6.5.8.1. India Hoverboards Market, 2016 – 2026 (USD Million)
      9. 6.5.9. South Korea
        1. 6.5.9.1. South Korea Hoverboards Market, 2016 – 2026 (USD Million)
      10. 6.5.10. South-East Asia
        1. 6.5.10.1. South-East Asia Hoverboards Market, 2016 – 2026 (USD Million)
      11. 6.5.11. Rest of Asia Pacific
        1. 6.5.11.1. Rest of Asia Pacific Hoverboards Market, 2016 – 2026 (USD Million)
    6. 6.6. Latin America
      1. 6.6.1. Latin America Hoverboards Market, 2016 – 2026 (USD Million)
        1. 6.6.1.1. Latin America Hoverboards Market, by Country, 2016 - 2026 (USD Million)
      2. 6.6.2. Latin America Hoverboards Market, by Product, 2016 – 2026
        1. 6.6.2.1. Latin America Hoverboards Market, by Product, 2016 – 2026 (USD Million)
      3. 6.6.3. Latin America Hoverboards Market, by Wheel Size, 2016 – 2026
        1. 6.6.3.1. Latin America Hoverboards Market, by Wheel Size, 2016 – 2026 (USD Million)
      4. 6.6.4. Latin America Hoverboards Market, by Application, 2016 – 2026
        1. 6.6.4.1. Latin America Hoverboards Market, by Application, 2016 – 2026 (USD Million)
      5. 6.6.5. Latin America Hoverboards Market, by Distribution Channel, 2016 – 2026
        1. 6.6.5.1. Latin America Hoverboards Market, by Distribution Channel, 2016 – 2026 (USD Million)
      6. 6.6.6. Brazil
        1. 6.6.6.1. Brazil Hoverboards Market, 2016 – 2026 (USD Million)
      7. 6.6.7. Mexico
        1. 6.6.7.1. Mexico Hoverboards Market, 2016 – 2026 (USD Million)
      8. 6.6.8. Rest of Latin America
        1. 6.6.8.1. Rest of Latin America Hoverboards Market, 2016 – 2026 (USD Million)
    7. 6.7. The Middle-East and Africa
      1. 6.7.1. The Middle-East and Africa Hoverboards Market, 2016 – 2026 (USD Million)
        1. 6.7.1.1. The Middle-East and Africa Hoverboards Market, by Country, 2016 - 2026 (USD Million)
      2. 6.7.2. The Middle-East and Africa Hoverboards Market, by Product, 2016 – 2026
        1. 6.7.2.1. The Middle-East and Africa Hoverboards Market, by Product, 2016 – 2026 (USD Million)
      3. 6.7.3. The Middle-East and Africa Hoverboards Market, by Wheel Size, 2016 – 2026
        1. 6.7.3.1. The Middle-East and Africa Hoverboards Market, by Wheel Size, 2016 – 2026 (USD Million)
      4. 6.7.4. The Middle-East and Africa Hoverboards Market, by Application, 2016 – 2026
        1. 6.7.4.1. The Middle-East and Africa Hoverboards Market, by Application, 2016 – 2026 (USD Million)
      5. 6.7.5. The Middle-East and Africa Hoverboards Market, by Distribution Channel, 2016 – 2026
        1. 6.7.5.1. The Middle-East and Africa Hoverboards Market, by Distribution Channel, 2016 – 2026 (USD Million)
      6. 6.7.6. GCC Countries
        1. 6.7.6.1. GCC Countries Hoverboards Market, 2016 – 2026 (USD Million)
      7. 6.7.7. South Africa
        1. 6.7.7.1. South Africa Hoverboards Market, 2016 – 2026 (USD Million)
      8. 6.7.8. Rest of Middle-East Africa
        1. 6.7.8.1. Rest of Middle-East Africa Hoverboards Market, 2016 – 2026 (USD Million)
  7. Chapter 7 Hoverboards Market – Competitive Landscape
    1. 7.1. Competitor Market Share – Revenue
    2. 7.2. Market Concentration Rate Analysis, Top 3 and Top 5 Players
    3. 7.3. Strategic Developments
      1. 7.3.1. Acquisitions and Mergers
      2. 7.3.2. New Products
      3. 7.3.3. Research & Development Activities
  8. Chapter 8 Company Profiles
    1. 8.1. Ninebot Inc.
      1. 8.1.1. Company Overview
      2. 8.1.2. Product/Service Portfolio
      3. 8.1.3. Ninebot Inc. Sales, Revenue, and Gross Margin
      4. 8.1.4. Ninebot Inc. Revenue and Growth Rate
      5. 8.1.5. Ninebot Inc. Market Share
      6. 8.1.6. Recent Initiatives, Funding/VC Activities, and Technological Innovations
    2. 8.2. HaloBoard
      1. 8.2.1. Company Overview
      2. 8.2.2. Product/Service Portfolio
      3. 8.2.3. HaloBoard Sales, Revenue, and Gross Margin
      4. 8.2.4. HaloBoard Revenue and Growth Rate
      5. 8.2.5. HaloBoard Market Share
      6. 8.2.6. Recent Initiatives, Funding/VC Activities, and Technological Innovations
    3. 8.3. Razor USA LLC
      1. 8.3.1. Company Overview
      2. 8.3.2. Product/Service Portfolio
      3. 8.3.3. Razor USA LLC Sales, Revenue, and Gross Margin
      4. 8.3.4. Razor USA LLC Revenue and Growth Rate
      5. 8.3.5. Razor USA LLC Market Share
      6. 8.3.6. Recent Initiatives, Funding/VC Activities, and Technological Innovations
    4. 8.4. EPIKGO
      1. 8.4.1. Company Overview
      2. 8.4.2. Product/Service Portfolio
      3. 8.4.3. EPIKGO Sales, Revenue, and Gross Margin
      4. 8.4.4. EPIKGO Revenue and Growth Rate
      5. 8.4.5. EPIKGO Market Share
      6. 8.4.6. Recent Initiatives, Funding/VC Activities, and Technological Innovations
    5. 8.5. Airwheel Technology Holding Co. Ltd.
      1. 8.5.1. Company Overview
      2. 8.5.2. Product/Service Portfolio
      3. 8.5.3. Airwheel Technology Holding Co. Ltd. Sales, Revenue, and Gross Margin
      4. 8.5.4. Airwheel Technology Holding Co. Ltd. Revenue and Growth Rate
      5. 8.5.5. Airwheel Technology Holding Co. Ltd. Market Share
      6. 8.5.6. Recent Initiatives, Funding/VC Activities, and Technological Innovations
    6. 8.6. Segway Inc.
      1. 8.6.1. Company Overview
      2. 8.6.2. Product/Service Portfolio
      3. 8.6.3. Segway Inc. Sales, Revenue, and Gross Margin
      4. 8.6.4. Segway Inc. Revenue and Growth Rate
      5. 8.6.5. Segway Inc. Market Share
      6. 8.6.6. Recent Initiatives, Funding/VC Activities, and Technological Innovations
    7. 8.7. Skque Products
      1. 8.7.1. Company Overview
      2. 8.7.2. Product/Service Portfolio
      3. 8.7.3. Skque Products Sales, Revenue, and Gross Margin
      4. 8.7.4. Skque Products Revenue and Growth Rate
      5. 8.7.5. Skque Products Market Share
      6. 8.7.6. Recent Initiatives, Funding/VC Activities, and Technological Innovations
    8. 8.8. TOMOLOO Technology Industrial Co. Ltd.
      1. 8.8.1. Company Overview
      2. 8.8.2. Product/Service Portfolio
      3. 8.8.3. TOMOLOO Technology Industrial Co. Ltd. Sales, Revenue, and Gross Margin
      4. 8.8.4. TOMOLOO Technology Industrial Co. Ltd. Revenue and Growth Rate
      5. 8.8.5. TOMOLOO Technology Industrial Co. Ltd. Market Share
      6. 8.8.6. Recent Initiatives, Funding/VC Activities, and Technological Innovations
    9. 8.9. Genesis
      1. 8.9.1. Company Overview
      2. 8.9.2. Product/Service Portfolio
      3. 8.9.3. Genesis Sales, Revenue, and Gross Margin
      4. 8.9.4. Genesis Revenue and Growth Rate
      5. 8.9.5. Genesis Market Share
      6. 8.9.6. Recent Initiatives, Funding/VC Activities, and Technological Innovations
    10. 8.10. Hangzhou Chic Intelligent Technology Co. Ltd.
      1. 8.10.1. Company Overview
      2. 8.10.2. Product/Service Portfolio
      3. 8.10.3. Hangzhou Chic Intelligent Technology Co. Ltd. Sales, Revenue, and Gross Margin
      4. 8.10.4. Hangzhou Chic Intelligent Technology Co. Ltd. Revenue and Growth Rate
      5. 8.10.5. Hangzhou Chic Intelligent Technology Co. Ltd. Market Share
      6. 8.10.6. Recent Initiatives, Funding/VC Activities, and Technological Innovations
    11. 8.11. Shenzhen Rooder Technology Co. Ltd
      1. 8.11.1. Company Overview
      2. 8.11.2. Product/Service Portfolio
      3. 8.11.3. Shenzhen Rooder Technology Co. Ltd Sales, Revenue, and Gross Margin
      4. 8.11.4. Shenzhen Rooder Technology Co. Ltd Revenue and Growth Rate
      5. 8.11.5. Shenzhen Rooder Technology Co. Ltd Market Share
      6. 8.11.6. Recent Initiatives, Funding/VC Activities, and Technological Innovations
    12. 8.12. Megawheels
      1. 8.12.1. Company Overview
      2. 8.12.2. Product/Service Portfolio
      3. 8.12.3. Megawheels Sales, Revenue, and Gross Margin
      4. 8.12.4. Megawheels Revenue and Growth Rate
      5. 8.12.5. Megawheels Market Share
      6. 8.12.6. Recent Initiatives, Funding/VC Activities, and Technological Innovations
    13. 8.13. SURFUS
      1. 8.13.1. Company Overview
      2. 8.13.2. Product/Service Portfolio
      3. 8.13.3. SURFUS Sales, Revenue, and Gross Margin
      4. 8.13.4. SURFUS Revenue and Growth Rate
      5. 8.13.5. SURFUS Market Share
      6. 8.13.6. Recent Initiatives, Funding/VC Activities, and Technological Innovations
    14. 8.14. Shenzhen JIALIKE Electronic Company Ltd.
      1. 8.14.1. Company Overview
      2. 8.14.2. Product/Service Portfolio
      3. 8.14.3. Shenzhen JIALIKE Electronic Company Ltd. Sales, Revenue, and Gross Margin
      4. 8.14.4. Shenzhen JIALIKE Electronic Company Ltd. Revenue and Growth Rate
      5. 8.14.5. Shenzhen JIALIKE Electronic Company Ltd. Market Share
      6. 8.14.6. Recent Initiatives, Funding/VC Activities, and Technological Innovations
    15. 8.15. Shenzhen Uwheel Technology Co. Ltd.
      1. 8.15.1. Company Overview
      2. 8.15.2. Product/Service Portfolio
      3. 8.15.3. Shenzhen Uwheel Technology Co. Ltd. Sales, Revenue, and Gross Margin
      4. 8.15.4. Shenzhen Uwheel Technology Co. Ltd. Revenue and Growth Rate
      5. 8.15.5. Shenzhen Uwheel Technology Co. Ltd. Market Share
      6. 8.15.6. Recent Initiatives, Funding/VC Activities, and Technological Innovations
  9. Chapter 9 Hoverboards — Industry Analysis
    1. 9.1. Introduction and Taxonomy
    2. 9.2. Hoverboards Market – Key Trends
      1. 9.2.1. Market Drivers
      2. 9.2.2. Market Restraints
      3. 9.2.3. Market Opportunities
    3. 9.3. Value Chain Analysis
    4. 9.4. Key Mandates and Regulations
    5. 9.5. Technology Roadmap and Timeline
    6. 9.6. Hoverboards Market – Attractiveness Analysis
      1. 9.6.1. By Product
      2. 9.6.2. By Wheel Size
      3. 9.6.3. By Application
      4. 9.6.4. By Distribution Channel
      5. 9.6.5. By Region
  10. Chapter 10 Industrial Chain, Sourcing Strategy, and Downstream Buyers
    1. 10.1. Hoverboards Industrial Chain Analysis
    2. 10.2. Downstream Buyers
    3. 10.3. Distributors/Traders List
  11. Chapter 11 Marketing Strategy Analysis
    1. 11.1. Marketing Channel
    2. 11.2. Direct Marketing
    3. 11.3. Indirect Marketing
    4. 11.4. Marketing Channel Development Trends
    5. 11.5. Economic/Political Environmental Change
  12. Chapter 12 Report Conclusion & Key Insights
    1. 12.1. Key Insights from Primary Interviews & Surveys Respondents
    2. 12.2. Key Takeaways from Analysts, Consultants, and Industry Leaders
  13. Chapter 13 Research Approach & Methodology
    1. 13.1. Report Description
    2. 13.2. Research Scope
    3. 13.3. Research Methodology
      1. 13.3.1. Secondary Research
      2. 13.3.2. Primary Research
      3. 13.3.3. Statistical Models
        1. 13.3.3.1. Company Share Analysis Model
        2. 13.3.3.2. Revenue Based Modeling
      4. 13.3.4. Research Limitations

      List of Figures

      Fig.1	Product Picture of Hoverboards
      Fig.2	Global Hoverboards Market, 2016 – 2026 (USD Million)
      Fig.3	Global Hoverboards Market Absolute Revenue Opportunity, 2016 – 2026 (USD Million)
      Fig.4	Global Hoverboards Market Incremental Revenue Opportunity, 2020 – 2026 (USD Million)
      Fig.5	Global Hoverboards Market Share, by Product, 2019 & 2026 (USD Million)
      Fig.6	Global Single Wheeled Hoverboards Market, 2016 – 2026 (USD Million)
      Fig.7	Global Double Wheeled Hoverboards Market, 2016 – 2026 (USD Million)
      Fig.8	Global Hoverboards Market Share, by Wheel Size, 2019 & 2026 (USD Million)
      Fig.9	Global 6.5 Inch Hoverboards Market, 2016 – 2026 (USD Million)
      Fig.10	Global 8 Inch Hoverboards Market, 2016 – 2026 (USD Million)
      Fig.11	Global 10 Inch Hoverboards Market, 2016 – 2026 (USD Million)
      Fig.12	Global Hoverboards Market Share, by Application, 2019 & 2026 (USD Million)
      Fig.13	Global Commercial Hoverboards Market, 2016 – 2026 (USD Million)
      Fig.14	Global Recreational Activities Hoverboards Market, 2016 – 2026 (USD Million)
      Fig.15	Global Personal Mobility Hoverboards Market, 2016 – 2026 (USD Million)
      Fig.16	Global Hoverboards Market Share, by Distribution Channel, 2019 & 2026 (USD Million)
      Fig.17	Global Online Hoverboards Market, 2016 – 2026 (USD Million)
      Fig.18	Global Offline Hoverboards Market, 2016 – 2026 (USD Million)
      Fig.19	Global Hoverboards Market Share, by Region, 2019 & 2026 (USD Million)
      Fig.20	North America Hoverboards Market, 2016 – 2026 (USD Million)
      Fig.21	U.S. Hoverboards Market, 2016 – 2026 (USD Million)
      Fig.22	Canada Hoverboards Market, 2016 – 2026 (USD Million)
      Fig.23	Europe Hoverboards Market, 2016 – 2026 (USD Million)
      Fig.24	Germany Hoverboards Market, 2016 – 2026 (USD Million)
      Fig.25	France Hoverboards Market, 2016 – 2026 (USD Million)
      Fig.26	U.K. Hoverboards Market, 2016 – 2026 (USD Million)
      Fig.27	Italy Hoverboards Market, 2016 – 2026 (USD Million)
      Fig.28	Spain Hoverboards Market, 2016 – 2026 (USD Million)
      Fig.29	Rest of Europe Hoverboards Market, 2016 – 2026 (USD Million)
      Fig.30	Asia Pacific Hoverboards Market, 2016 – 2026 (USD Million)
      Fig.31	China Hoverboards Market, 2016 – 2026 (USD Million)
      Fig.32	Japan Hoverboards Market, 2016 – 2026 (USD Million)
      Fig.33	India Hoverboards Market, 2016 – 2026 (USD Million)
      Fig.34	South  Korea Hoverboards Market, 2016 – 2026 (USD Million)
      Fig.35	South-East Asia Hoverboards Market, 2016 – 2026 (USD Million)
      Fig.36	Rest of Asia Pacific Hoverboards Market, 2016 – 2026 (USD Million)
      Fig.37	Latin America Hoverboards Market, 2016 – 2026 (USD Million)
      Fig.38	Brazil Hoverboards Market, 2016 – 2026 (USD Million)
      Fig.39	Mexico Hoverboards Market, 2016 – 2026 (USD Million)
      Fig.40	Rest of Latin America Hoverboards Market, 2016 – 2026 (USD Million)
      Fig.41	The Middle-East and Africa Hoverboards Market, 2016 – 2026 (USD Million)
      Fig.42	GCC Countries Hoverboards Market, 2016 – 2026 (USD Million)
      Fig.43	South Africa Hoverboards Market, 2016 – 2026 (USD Million)
      Fig.44	Rest of Middle-East Africa Hoverboards Market, 2016 – 2026 (USD Million)
      Fig.45	Competitor Market Share – Revenue
      Fig.46	Ninebot Inc. Revenue and Growth Rate
      Fig.47	Ninebot Inc. Market Share
      Fig.48	HaloBoard Revenue and Growth Rate
      Fig.49	HaloBoard Market Share
      Fig.50	Razor USA LLC Revenue and Growth Rate
      Fig.51	Razor USA LLC Market Share
      Fig.52	EPIKGO Revenue and Growth Rate
      Fig.53	EPIKGO Market Share
      Fig.54	Airwheel Technology Holding Co. Ltd. Revenue and Growth Rate
      Fig.55	Airwheel Technology Holding Co. Ltd. Market Share
      Fig.56	Segway Inc. Revenue and Growth Rate
      Fig.57	Segway Inc. Market Share
      Fig.58	Skque Products Revenue and Growth Rate
      Fig.59	Skque Products Market Share
      Fig.60	TOMOLOO Technology Industrial Co. Ltd. Revenue and Growth Rate
      Fig.61	TOMOLOO Technology Industrial Co. Ltd. Market Share
      Fig.62	Genesis Revenue and Growth Rate
      Fig.63	Genesis Market Share
      Fig.64	Hangzhou Chic Intelligent Technology Co. Ltd. Revenue and Growth Rate
      Fig.65	Hangzhou Chic Intelligent Technology Co. Ltd. Market Share
      Fig.66	Shenzhen Rooder Technology Co. Ltd Revenue and Growth Rate
      Fig.67	Shenzhen Rooder Technology Co. Ltd Market Share
      Fig.68	Megawheels Revenue and Growth Rate
      Fig.69	Megawheels Market Share
      Fig.70	SURFUS Revenue and Growth Rate
      Fig.71	SURFUS Market Share
      Fig.72	Shenzhen JIALIKE Electronic Company Ltd. Revenue and Growth Rate
      Fig.73	Shenzhen JIALIKE Electronic Company Ltd. Market Share
      Fig.74	Shenzhen Uwheel Technology Co. Ltd. Revenue and Growth Rate
      Fig.75	Shenzhen Uwheel Technology Co. Ltd. Market Share
      Fig.76	Market Dynamics
      Fig.77	Global Hoverboards – Value Chain Analysis
      Fig.78	Key Mandates and Regulations
      Fig.79	Technology Roadmap and Timeline
      Fig.80	Market Attractiveness Analysis – By Product
      Fig.81	Market Attractiveness Analysis – By Wheel Size
      Fig.82	Market Attractiveness Analysis – By Application
      Fig.83	Market Attractiveness Analysis – By Distribution Channel
      Fig.84	Market Attractiveness Analysis – By Region
      Fig.85	Hoverboards Industrial Chain Analysis
      Fig.86	Market Channels
      Fig.87	Marketing Channel Development Trend
      Fig.88	Growth in World Gross Product, 2008-2018
      

      List of Tables

      Table 1	Global Hoverboards Market, 2019 & 2026 (USD Million)
      Table 2	Global Hoverboards Market, by Product, 2016 – 2026 (USD Million)
      Table 3	Global Hoverboards Market, by Wheel Size, 2016 – 2026 (USD Million)
      Table 4	Global Hoverboards Market, by Application, 2016 – 2026 (USD Million)
      Table 5	Global Hoverboards Market, by Distribution Channel, 2016 – 2026 (USD Million)
      Table 6	Global Hoverboards Market, by Region, 2016 – 2026 (USD Million)
      Table 7	North America Hoverboards Market, by Country, 2016 – 2026 (USD Million)
      Table 8	North America Hoverboards Market, by Product, 2016 – 2026 (USD Million)
      Table 9	North America Hoverboards Market, by Wheel Size, 2016 – 2026 (USD Million)
      Table 10 North America Hoverboards Market, by Application, 2016 – 2026 (USD Million)
      Table 11 North America Hoverboards Market, by Distribution Channel, 2016 – 2026 (USD Million)
      Table 12 Europe Hoverboards Market, by Country, 2016 – 2026 (USD Million)
      Table 13 Europe Hoverboards Market, by Product, 2016 – 2026 (USD Million)
      Table 14 Europe Hoverboards Market, by Wheel Size, 2016 – 2026 (USD Million)
      Table 15 Europe Hoverboards Market, by Application, 2016 – 2026 (USD Million)
      Table 16 Europe Hoverboards Market, by Distribution Channel, 2016 – 2026 (USD Million)
      Table 17 Asia Pacific Hoverboards Market, by Country, 2016 – 2026 (USD Million)
      Table 18 Asia Pacific Hoverboards Market, by Product, 2016 – 2026 (USD Million)
      Table 19 Asia Pacific Hoverboards Market, by Wheel Size, 2016 – 2026 (USD Million)
      Table 20 Asia Pacific Hoverboards Market, by Application, 2016 – 2026 (USD Million)
      Table 21 Asia Pacific Hoverboards Market, by Distribution Channel, 2016 – 2026 (USD Million)
      Table 22 Latin America Hoverboards Market, by Country, 2016 – 2026 (USD Million)
      Table 23 Latin America Hoverboards Market, by Product, 2016 – 2026 (USD Million)
      Table 24 Latin America Hoverboards Market, by Wheel Size, 2016 – 2026 (USD Million)
      Table 25 Latin America Hoverboards Market, by Application, 2016 – 2026 (USD Million)
      Table 26 Latin America Hoverboards Market, by Distribution Channel, 2016 – 2026 (USD Million)
      Table 27 The Middle-East and Africa Hoverboards Market, by Country, 2016 – 2026 (USD Million)
      Table 28 The Middle-East and Africa Hoverboards Market, by Product, 2016 – 2026 (USD Million)
      Table 29 The Middle-East and Africa Hoverboards Market, by Wheel Size, 2016 – 2026 (USD Million)
      Table 30 The Middle-East and Africa Hoverboards Market, by Application, 2016 – 2026 (USD Million)
      Table 31 The Middle-East and Africa Hoverboards Market, by Distribution Channel, 2016 – 2026 (USD Million)
      Table 32 Global Hoverboards Market - Company Revenue Analysis, 2016 – 2019 (USD Million)
      Table 33 Global Hoverboards Market - Company Revenue Share Analysis, 2016 – 2019 (%)
      Table 34 Acquisitions and Mergers
      Table 35 Market Drivers – Impact Analysis
      Table 36 Market Restraints
      Table 37 Market Opportunities
      Table 38 Major Buyers of Hoverboards
      Table 39 Distributors/Traders of Hoverboards by Region
      

Industry Major Market Players

  • Ninebot Inc.
  • HaloBoard
  • Razor USA LLC
  • EPIKGO
  • Airwheel Technology Holding Co. Ltd.
  • Segway Inc.
  • Skque Products
  • TOMOLOO Technology Industrial Co. Ltd.
  • Genesis
  • Hangzhou Chic Intelligent Technology Co. Ltd.
  • Shenzhen Rooder Technology Co. Ltd
  • Megawheels
  • SURFUS
  • Shenzhen JIALIKE Electronic Company Ltd.
  • Shenzhen Uwheel Technology Co. Ltd.