Search Market Research Report

Discover Our Latest Reports
Discover Our Featured Reports
Discover Top Selling Reports

Artificial Intelligence (AI) in Food and Beverages Market Size, Share Global Analysis Report, 2021 – 2026

report img

Artificial Intelligence (AI) in Food and Beverages Market By Organization Size (Small, Medium & Large Enterprises), By Application (Food Sorting, Quality Control, and Safety Compliance, Consumer Engagement, Production and Packaging, Maintenance, and Other Applications), By End-Use Industry (Food Processing, Grocery, Hotels & Beverages Industry, and Others Region: Global & Regional Industry Perspective, Comprehensive Analysis, and Forecast 2021 – 2026

Industry Insights

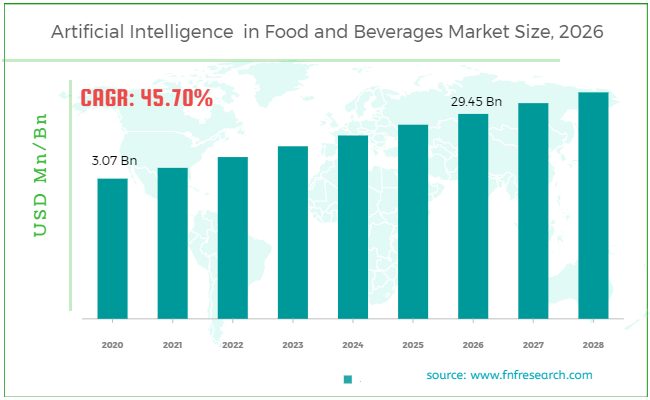
[223+ Pages Report] According to a survey released by Facts and Factors, the global Artificial Intelligence (AI) in Food and Beverages market was valued at USD 3.07 Billion in 2020 and is predicted to reach USD 29.45 Billion by the end of 2026, rising at a CAGR of nearly 45.70% between 2021 and 2026.

Artificial Intelligence (AI) in Food and Beverages Market Size

To know more about this report | Request Free Sample Copy

logoMarket Overview       

Artificial Intelligence (AI) is the process of making intelligent machines that act and react in the same way that people do. The purpose is to teach machines to think intelligently in the same manner that people do. Until recently, the machines have done exactly what they were taught. However, AI will allow computers to think and act like humans. AI is being used in the food processing sector to improve diverse offers, optimize processes, and provide a better consumer experience. Artificial intelligence (AI), today's most important general-purpose technology, is rapidly infiltrating sectors, presenting enormous potential for innovation and prosperity. AI has already altered the competition rules and produced substantial changes. Food and beverage companies want to leverage artificial intelligence (AI) technology to produce value instead of relying on traditional, human-centered business procedures. Commodity cycles, capital planning issues, and growing operational risks all make it more important than ever to make smarter, more efficient decisions in the food and beverage industry.

Artificial Intelligence (AI) in Food and Beverages Market

To know more about this report | Request Free Sample Copy

logoIndustry Growth Factors

Artificial Intelligence (AI) in Food and Beverage Market is projected to be driven by the growing need to analyze consumer buying behavior and predict inventory levels to reduce food waste. The rising need for AI implementation to improve supply chain processes is expected to boost AI in the food and beverages market within the forecast period. Furthermore, increasing research and development activities, as well as modernization and technological advancements in the devices used to monitor artificial intelligence in the food sector, will create new opportunities for artificial intelligence in the food & beverages market over the forecast period. Strict standards in the regulation of food and safety processes and higher costs of machinery/equipment improvements are some factors that limit the development of artificial intelligence (AI) in the food and beverages market. The food and beverage industry's growing embrace of big data technologies to supplement manufacturing capacities. A significant increase in venture capital investments, as well as growing demand for automation in the industry, as well as great pressure to reduce production costs, are projected to fuel the rise of artificial intelligence (AI) in the food and beverage sector. Growing investments in food and beverage infrastructure, as well as a greater emphasis on automation and digitalization, are projected to fuel the rise of AI in the food and beverage sector.

logoSegmentation Analysis

The global artificial intelligence (AI) in the food and beverages market is segregated based on organization size, application, end-user, and region. Based on organization size, the global artificial intelligence (AI) in the food and beverages industry is categorized into small, and medium & large enterprises. Based on application, global artificial intelligence (AI) in the food and beverage industry is categorized into quality control and safety compliance, food sorting, production and packaging, consumer engagement, maintenance, and other applications. Based on the end-user, global artificial intelligence (AI) in the food and beverages industry is categorized into food processing, grocery, hotels & beverages industry, and others.     

logo Regional Analysis

In 2020, North America is likely to be the leading regional artificial intelligence (AI) in the food and beverages market. North America is expected to have the largest market share, given the overall inclination and excitement demonstrated by the region's wider population for AI in food and beverages. In North America, AI in the food and beverage sector is increasing, with the United States leading the way. Their readiness for adoption and high fractional increase in adoption of AI, which reflects the region's leading position on AI and its implementation, as well as the high automation potential expected at the regional level between now and 2030, are the leading drivers of their economic impact in North America.

logoReport Scope

Report Attribute

Details

Market Size in 2020

USD 3.07 Billion

Projected Market Size in 2026

USD 29.45 Billion

CAGR Growth Rate

45.70% CAGR

Base Year 2020

Forecast Years

2021-2026

Key Market Players

ABB Ltd., Agco Corporation, BBC technologies, BoMill AB, Bratney Companies, Buhler Holding AG, Compac Sorting Equipment, Duravant LLC, Foodable Network, LLC, GREEFA, Honeywell International, Inc., INTELLIGENTX Brewing Co., Key Technology Inc., Martec Of Whitwell Ltd., Max-Ai, MilltecClarfai, Inc., National Recovery Technologies, Llc, QualySense AG, Rockwell Automation, Inc., Raytec Vision SpA, Sight Machine Inc., Sesotec GmbH, Startup Creator, and TOMRA Systems, amongst others.

Key Segment

By Organization Size, By Application, By End-Use, By Region

Major Regions Covered

North America, Europe, Asia Pacific, Latin America, and the Middle East & Africa

Purchase Options

Request customized purchase options to meet your research needs. Explore purchase options

logo Competitive Players

Some main participants of the global artificial intelligence (AI) in the food and beverages market are :

  • ABB Ltd.
  • Agco Corporation
  • BBC technologies
  • BoMill AB
  • Bratney Companies
  • Buhler Holding AG
  • Compac Sorting Equipment
  • Duravant LLC
  • Foodable Network LLC
  • GREEFA
  • Honeywell International Inc.
  • INTELLIGENTX Brewing Co.
  • Key Technology Inc.
  • Martec Of Whitwell Ltd.
  • Max-Ai
  • MilltecClarfai Inc.
  • National Recovery Technologies Llc
  • QualySense AG
  • Raytec Vision SpA
  • Rockwell Automation Inc.
  • Sesotec GmbH
  • Sight Machine Inc.
  • Startup Creator
  • TOMRA Systems
  • amongst others

logo By Organization Size:

  • Small
  • Medium & Large Enterprises

logo By Application:

  • Food Sorting
  • Quality Control and Safety Compliance
  • Consumer Engagement
  • Production and Packaging
  • Maintenance
  • Other Applications

logo By End-Use Industry:

  • Food Processing
  • Grocery
  • Hotels & Beverages Industry
  • Others

logo By Region:

  • North America
    • The U.S.
    • Canada
  • Europe
    • France
    • The UK
    • Spain
    • Germany
    • Italy
    • Rest of Europe
  • Asia Pacific
    • China
    • Japan
    • India
    • South Korea
    • Southeast Asia
    • Rest of Asia Pacific
  • Latin America
    • Brazil
    • Mexico
    • Rest of Latin America
  • Middle East & Africa
    • GCC Countries
    • South Africa
    • Rest of Middle East & Africa

Table of Content

  1. Chapter 1 Executive Summary
    1. 1.1. Introduction of Artificial Intelligence (AI) in Food and Beverages
    2. 1.2. Global Artificial Intelligence (AI) in Food and Beverages Market, 2020 & 2026 (USD Million)
    3. 1.3. Global Artificial Intelligence (AI) in Food and Beverages Market, 2016 – 2026 (USD Million)
    4. 1.4. Global Artificial Intelligence (AI) in Food and Beverages Market Absolute Revenue Opportunity, 2016 – 2026 (USD Million)
    5. 1.5. Global Artificial Intelligence (AI) in Food and Beverages Market Incremental Revenue Opportunity, 2020 – 2026 (USD Million)
  2. Chapter 2 Artificial Intelligence (AI) in Food and Beverages Market – Organization Size Analysis
    1. 2.1. Global Artificial Intelligence (AI) in Food and Beverages Market – Organization Size Overview
    2. 2.2. Global Artificial Intelligence (AI) in Food and Beverages Market Share, by Organization Size, 2020 & 2026 (USD Million)
    3. 2.3. Small
      1. 2.3.1. Global Small Artificial Intelligence (AI) in Food and Beverages Market, 2016 – 2026 (USD Million)
    4. 2.4. Medium & Large Enterprises
      1. 2.4.1. Global Medium & Large Enterprises Artificial Intelligence (AI) in Food and Beverages Market, 2016 – 2026 (USD Million)
  3. Chapter 3 Artificial Intelligence (AI) in Food and Beverages Market – Application Analysis
    1. 3.1. Global Artificial Intelligence (AI) in Food and Beverages Market – Application Overview
    2. 3.2. Global Artificial Intelligence (AI) in Food and Beverages Market Share, by Application, 2020 & 2026 (USD Million)
    3. 3.3. Food Sorting
      1. 3.3.1. Global Food Sorting Artificial Intelligence (AI) in Food and Beverages Market, 2016 – 2026 (USD Million)
    4. 3.4. Quality Control and Safety Compliance
      1. 3.4.1. Global Quality Control and Safety Compliance Artificial Intelligence (AI) in Food and Beverages Market, 2016 – 2026 (USD Million)
    5. 3.5. Consumer Engagement
      1. 3.5.1. Global Consumer Engagement Artificial Intelligence (AI) in Food and Beverages Market, 2016 – 2026 (USD Million)
    6. 3.6. Production and Packaging
      1. 3.6.1. Global Production and Packaging Artificial Intelligence (AI) in Food and Beverages Market, 2016 – 2026 (USD Million)
    7. 3.7. Maintenance
      1. 3.7.1. Global Maintenance Artificial Intelligence (AI) in Food and Beverages Market, 2016 – 2026 (USD Million)
    8. 3.8. Other Applications
      1. 3.8.1. Global Other Applications Artificial Intelligence (AI) in Food and Beverages Market, 2016 – 2026 (USD Million)
  4. Chapter 4 Artificial Intelligence (AI) in Food and Beverages Market – End-Use Industry Analysis
    1. 4.1. Global Artificial Intelligence (AI) in Food and Beverages Market – End-Use Industry Overview
    2. 4.2. Global Artificial Intelligence (AI) in Food and Beverages Market Share, by End-Use Industry, 2020 & 2026 (USD Million)
    3. 4.3. Food Processing
      1. 4.3.1. Global Food Processing Artificial Intelligence (AI) in Food and Beverages Market, 2016 – 2026 (USD Million)
    4. 4.4. Grocery
      1. 4.4.1. Global Grocery Artificial Intelligence (AI) in Food and Beverages Market, 2016 – 2026 (USD Million)
    5. 4.5. Hotels & Beverages Industry
      1. 4.5.1. Global Hotels & Beverages Industry Artificial Intelligence (AI) in Food and Beverages Market, 2016 – 2026 (USD Million)
    6. 4.6. Others
      1. 4.6.1. Global Others Artificial Intelligence (AI) in Food and Beverages Market, 2016 – 2026 (USD Million)
  5. Chapter 5 Artificial Intelligence (AI) in Food and Beverages Market – Regional Analysis
    1. 5.1. Global Artificial Intelligence (AI) in Food and Beverages Market Regional Overview
    2. 5.2. Global Artificial Intelligence (AI) in Food and Beverages Market Share, by Region, 2020 & 2026 (USD Million)
    3. 5.3. North America
      1. 5.3.1. North America Artificial Intelligence (AI) in Food and Beverages Market, 2016 – 2026 (USD Million)
        1. 5.3.1.1. North America Artificial Intelligence (AI) in Food and Beverages Market, by Country, 2016 - 2026 (USD Million)
      2. 5.3.2. North America Artificial Intelligence (AI) in Food and Beverages Market, by Organization Size, 2016 – 2026
        1. 5.3.2.1. North America Artificial Intelligence (AI) in Food and Beverages Market, by Organization Size, 2016 – 2026 (USD Million)
      3. 5.3.3. North America Artificial Intelligence (AI) in Food and Beverages Market, by Application, 2016 – 2026
        1. 5.3.3.1. North America Artificial Intelligence (AI) in Food and Beverages Market, by Application, 2016 – 2026 (USD Million)
      4. 5.3.4. North America Artificial Intelligence (AI) in Food and Beverages Market, by End-Use Industry, 2016 – 2026
        1. 5.3.4.1. North America Artificial Intelligence (AI) in Food and Beverages Market, by End-Use Industry, 2016 – 2026 (USD Million)
      5. 5.3.5. U.S.
        1. 5.3.5.1. U.S. Artificial Intelligence (AI) in Food and Beverages Market, 2016 – 2026 (USD Million)
      6. 5.3.6. Canada
        1. 5.3.6.1. Canada Artificial Intelligence (AI) in Food and Beverages Market, 2016 – 2026 (USD Million)
    4. 5.4. Europe
      1. 5.4.1. Europe Artificial Intelligence (AI) in Food and Beverages Market, 2016 – 2026 (USD Million)
        1. 5.4.1.1. Europe Artificial Intelligence (AI) in Food and Beverages Market, by Country, 2016 - 2026 (USD Million)
      2. 5.4.2. Europe Artificial Intelligence (AI) in Food and Beverages Market, by Organization Size, 2016 – 2026
        1. 5.4.2.1. Europe Artificial Intelligence (AI) in Food and Beverages Market, by Organization Size, 2016 – 2026 (USD Million)
      3. 5.4.3. Europe Artificial Intelligence (AI) in Food and Beverages Market, by Application, 2016 – 2026
        1. 5.4.3.1. Europe Artificial Intelligence (AI) in Food and Beverages Market, by Application, 2016 – 2026 (USD Million)
      4. 5.4.4. Europe Artificial Intelligence (AI) in Food and Beverages Market, by End-Use Industry, 2016 – 2026
        1. 5.4.4.1. Europe Artificial Intelligence (AI) in Food and Beverages Market, by End-Use Industry, 2016 – 2026 (USD Million)
      5. 5.4.5. Germany
        1. 5.4.5.1. Germany Artificial Intelligence (AI) in Food and Beverages Market, 2016 – 2026 (USD Million)
      6. 5.4.6. France
        1. 5.4.6.1. France Artificial Intelligence (AI) in Food and Beverages Market, 2016 – 2026 (USD Million)
      7. 5.4.7. U.K.
        1. 5.4.7.1. U.K. Artificial Intelligence (AI) in Food and Beverages Market, 2016 – 2026 (USD Million)
      8. 5.4.8. Italy
        1. 5.4.8.1. Italy Artificial Intelligence (AI) in Food and Beverages Market, 2016 – 2026 (USD Million)
      9. 5.4.9. Spain
        1. 5.4.9.1. Spain Artificial Intelligence (AI) in Food and Beverages Market, 2016 – 2026 (USD Million)
      10. 5.4.10. Rest of Europe
        1. 5.4.10.1. Rest of Europe Artificial Intelligence (AI) in Food and Beverages Market, 2016 – 2026 (USD Million)
    5. 5.5. Asia Pacific
      1. 5.5.1. Asia Pacific Artificial Intelligence (AI) in Food and Beverages Market, 2016 – 2026 (USD Million)
        1. 5.5.1.1. Asia Pacific Artificial Intelligence (AI) in Food and Beverages Market, by Country, 2016 - 2026 (USD Million)
      2. 5.5.2. Asia Pacific Artificial Intelligence (AI) in Food and Beverages Market, by Organization Size, 2016 – 2026
        1. 5.5.2.1. Asia Pacific Artificial Intelligence (AI) in Food and Beverages Market, by Organization Size, 2016 – 2026 (USD Million)
      3. 5.5.3. Asia Pacific Artificial Intelligence (AI) in Food and Beverages Market, by Application, 2016 – 2026
        1. 5.5.3.1. Asia Pacific Artificial Intelligence (AI) in Food and Beverages Market, by Application, 2016 – 2026 (USD Million)
      4. 5.5.4. Asia Pacific Artificial Intelligence (AI) in Food and Beverages Market, by End-Use Industry, 2016 – 2026
        1. 5.5.4.1. Asia Pacific Artificial Intelligence (AI) in Food and Beverages Market, by End-Use Industry, 2016 – 2026 (USD Million)
      5. 5.5.5. China
        1. 5.5.5.1. China Artificial Intelligence (AI) in Food and Beverages Market, 2016 – 2026 (USD Million)
      6. 5.5.6. Japan
        1. 5.5.6.1. Japan Artificial Intelligence (AI) in Food and Beverages Market, 2016 – 2026 (USD Million)
      7. 5.5.7. India
        1. 5.5.7.1. India Artificial Intelligence (AI) in Food and Beverages Market, 2016 – 2026 (USD Million)
      8. 5.5.8. South Korea
        1. 5.5.8.1. South Korea Artificial Intelligence (AI) in Food and Beverages Market, 2016 – 2026 (USD Million)
      9. 5.5.9. South-East Asia
        1. 5.5.9.1. South-East Asia Artificial Intelligence (AI) in Food and Beverages Market, 2016 – 2026 (USD Million)
      10. 5.5.10. Rest of Asia Pacific
        1. 5.5.10.1. Rest of Asia Pacific Artificial Intelligence (AI) in Food and Beverages Market, 2016 – 2026 (USD Million)
    6. 5.6. Latin America
      1. 5.6.1. Latin America Artificial Intelligence (AI) in Food and Beverages Market, 2016 – 2026 (USD Million)
        1. 5.6.1.1. Latin America Artificial Intelligence (AI) in Food and Beverages Market, by Country, 2016 - 2026 (USD Million)
      2. 5.6.2. Latin America Artificial Intelligence (AI) in Food and Beverages Market, by Organization Size, 2016 – 2026
        1. 5.6.2.1. Latin America Artificial Intelligence (AI) in Food and Beverages Market, by Organization Size, 2016 – 2026 (USD Million)
      3. 5.6.3. Latin America Artificial Intelligence (AI) in Food and Beverages Market, by Application, 2016 – 2026
        1. 5.6.3.1. Latin America Artificial Intelligence (AI) in Food and Beverages Market, by Application, 2016 – 2026 (USD Million)
      4. 5.6.4. Latin America Artificial Intelligence (AI) in Food and Beverages Market, by End-Use Industry, 2016 – 2026
        1. 5.6.4.1. Latin America Artificial Intelligence (AI) in Food and Beverages Market, by End-Use Industry, 2016 – 2026 (USD Million)
      5. 5.6.5. Brazil
        1. 5.6.5.1. Brazil Artificial Intelligence (AI) in Food and Beverages Market, 2016 – 2026 (USD Million)
      6. 5.6.6. Mexico
        1. 5.6.6.1. Mexico Artificial Intelligence (AI) in Food and Beverages Market, 2016 – 2026 (USD Million)
      7. 5.6.7. Rest of Latin America
        1. 5.6.7.1. Rest of Latin America Artificial Intelligence (AI) in Food and Beverages Market, 2016 – 2026 (USD Million)
    7. 5.7. The Middle-East and Africa
      1. 5.7.1. The Middle-East and Africa Artificial Intelligence (AI) in Food and Beverages Market, 2016 – 2026 (USD Million)
        1. 5.7.1.1. The Middle-East and Africa Artificial Intelligence (AI) in Food and Beverages Market, by Country, 2016 - 2026 (USD Million)
      2. 5.7.2. The Middle-East and Africa Artificial Intelligence (AI) in Food and Beverages Market, by Organization Size, 2016 – 2026
        1. 5.7.2.1. The Middle-East and Africa Artificial Intelligence (AI) in Food and Beverages Market, by Organization Size, 2016 – 2026 (USD Million)
      3. 5.7.3. The Middle-East and Africa Artificial Intelligence (AI) in Food and Beverages Market, by Application, 2016 – 2026
        1. 5.7.3.1. The Middle-East and Africa Artificial Intelligence (AI) in Food and Beverages Market, by Application, 2016 – 2026 (USD Million)
      4. 5.7.4. The Middle-East and Africa Artificial Intelligence (AI) in Food and Beverages Market, by End-Use Industry, 2016 – 2026
        1. 5.7.4.1. The Middle-East and Africa Artificial Intelligence (AI) in Food and Beverages Market, by End-Use Industry, 2016 – 2026 (USD Million)
      5. 5.7.5. GCC Countries
        1. 5.7.5.1. GCC Countries Artificial Intelligence (AI) in Food and Beverages Market, 2016 – 2026 (USD Million)
      6. 5.7.6. South Africa
        1. 5.7.6.1. South Africa Artificial Intelligence (AI) in Food and Beverages Market, 2016 – 2026 (USD Million)
      7. 5.7.7. Rest of Middle-East Africa
        1. 5.7.7.1. Rest of Middle-East Africa Artificial Intelligence (AI) in Food and Beverages Market, 2016 – 2026 (USD Million)
  6. Chapter 6 Artificial Intelligence (AI) in Food and Beverages Market – Competitive Landscape
    1. 6.1. Competitor Market Share – Revenue
    2. 6.2. Market Concentration Rate Analysis, Top 3 and Top 5 Players
    3. 6.3. Strategic Developments
      1. 6.3.1. Acquisitions and Mergers
      2. 6.3.2. New Products
      3. 6.3.3. Research & Development Activities
  7. Chapter 7 Company Profiles
    1. 7.1. Rockwell Automation, Inc.
      1. 7.1.1. Company Overview
      2. 7.1.2. Product/Service Portfolio
      3. 7.1.3. Rockwell Automation, Inc. Sales, Revenue, and Gross Margin
      4. 7.1.4. Rockwell Automation, Inc. Revenue and Growth Rate
      5. 7.1.5. Rockwell Automation, Inc. Market Share
      6. 7.1.6. Recent Initiatives, Funding/VC Activities, and Technological Innovations
    2. 7.2. Raytec Vision SpA
      1. 7.2.1. Company Overview
      2. 7.2.2. Product/Service Portfolio
      3. 7.2.3. Raytec Vision SpA Sales, Revenue, and Gross Margin
      4. 7.2.4. Raytec Vision SpA Revenue and Growth Rate
      5. 7.2.5. Raytec Vision SpA Market Share
      6. 7.2.6. Recent Initiatives, Funding/VC Activities, and Technological Innovations
    3. 7.3. ABB Ltd.
      1. 7.3.1. Company Overview
      2. 7.3.2. Product/Service Portfolio
      3. 7.3.3. ABB Ltd. Sales, Revenue, and Gross Margin
      4. 7.3.4. ABB Ltd. Revenue and Growth Rate
      5. 7.3.5. ABB Ltd. Market Share
      6. 7.3.6. Recent Initiatives, Funding/VC Activities, and Technological Innovations
    4. 7.4. Honeywell International, Inc.
      1. 7.4.1. Company Overview
      2. 7.4.2. Product/Service Portfolio
      3. 7.4.3. Honeywell International, Inc. Sales, Revenue, and Gross Margin
      4. 7.4.4. Honeywell International, Inc. Revenue and Growth Rate
      5. 7.4.5. Honeywell International, Inc. Market Share
      6. 7.4.6. Recent Initiatives, Funding/VC Activities, and Technological Innovations
    5. 7.5. Duravant LLC
      1. 7.5.1. Company Overview
      2. 7.5.2. Product/Service Portfolio
      3. 7.5.3. Duravant LLC Sales, Revenue, and Gross Margin
      4. 7.5.4. Duravant LLC Revenue and Growth Rate
      5. 7.5.5. Duravant LLC Market Share
      6. 7.5.6. Recent Initiatives, Funding/VC Activities, and Technological Innovations
    6. 7.6. TOMRA Systems
      1. 7.6.1. Company Overview
      2. 7.6.2. Product/Service Portfolio
      3. 7.6.3. TOMRA Systems Sales, Revenue, and Gross Margin
      4. 7.6.4. TOMRA Systems Revenue and Growth Rate
      5. 7.6.5. TOMRA Systems Market Share
      6. 7.6.6. Recent Initiatives, Funding/VC Activities, and Technological Innovations
    7. 7.7. GREEFA
      1. 7.7.1. Company Overview
      2. 7.7.2. Product/Service Portfolio
      3. 7.7.3. GREEFA Sales, Revenue, and Gross Margin
      4. 7.7.4. GREEFA Revenue and Growth Rate
      5. 7.7.5. GREEFA Market Share
      6. 7.7.6. Recent Initiatives, Funding/VC Activities, and Technological Innovations
    8. 7.8. Sesotec GmbH
      1. 7.8.1. Company Overview
      2. 7.8.2. Product/Service Portfolio
      3. 7.8.3. Sesotec GmbH Sales, Revenue, and Gross Margin
      4. 7.8.4. Sesotec GmbH Revenue and Growth Rate
      5. 7.8.5. Sesotec GmbH Market Share
      6. 7.8.6. Recent Initiatives, Funding/VC Activities, and Technological Innovations
    9. 7.9. Martec Of Whitwell Ltd.
      1. 7.9.1. Company Overview
      2. 7.9.2. Product/Service Portfolio
      3. 7.9.3. Martec Of Whitwell Ltd. Sales, Revenue, and Gross Margin
      4. 7.9.4. Martec Of Whitwell Ltd. Revenue and Growth Rate
      5. 7.9.5. Martec Of Whitwell Ltd. Market Share
      6. 7.9.6. Recent Initiatives, Funding/VC Activities, and Technological Innovations
    10. 7.10. Buhler Holding AG
      1. 7.10.1. Company Overview
      2. 7.10.2. Product/Service Portfolio
      3. 7.10.3. Buhler Holding AG Sales, Revenue, and Gross Margin
      4. 7.10.4. Buhler Holding AG Revenue and Growth Rate
      5. 7.10.5. Buhler Holding AG Market Share
      6. 7.10.6. Recent Initiatives, Funding/VC Activities, and Technological Innovations
    11. 7.11. Key Technology Inc.
      1. 7.11.1. Company Overview
      2. 7.11.2. Product/Service Portfolio
      3. 7.11.3. Key Technology Inc. Sales, Revenue, and Gross Margin
      4. 7.11.4. Key Technology Inc. Revenue and Growth Rate
      5. 7.11.5. Key Technology Inc. Market Share
      6. 7.11.6. Recent Initiatives, Funding/VC Activities, and Technological Innovations
    12. 7.12. Sight Machine Inc
      1. 7.12.1. Company Overview
      2. 7.12.2. Product/Service Portfolio
      3. 7.12.3. Sight Machine Inc Sales, Revenue, and Gross Margin
      4. 7.12.4. Sight Machine Inc Revenue and Growth Rate
      5. 7.12.5. Sight Machine Inc Market Share
      6. 7.12.6. Recent Initiatives, Funding/VC Activities, and Technological Innovations
    13. 7.13. Foodable Network, LLC
      1. 7.13.1. Company Overview
      2. 7.13.2. Product/Service Portfolio
      3. 7.13.3. Foodable Network, LLC Sales, Revenue, and Gross Margin
      4. 7.13.4. Foodable Network, LLC Revenue and Growth Rate
      5. 7.13.5. Foodable Network, LLC Market Share
      6. 7.13.6. Recent Initiatives, Funding/VC Activities, and Technological Innovations
    14. 7.14. Startup Creator
      1. 7.14.1. Company Overview
      2. 7.14.2. Product/Service Portfolio
      3. 7.14.3. Startup Creator Sales, Revenue, and Gross Margin
      4. 7.14.4. Startup Creator Revenue and Growth Rate
      5. 7.14.5. Startup Creator Market Share
      6. 7.14.6. Recent Initiatives, Funding/VC Activities, and Technological Innovations
    15. 7.15. Compac Sorting Equipment
      1. 7.15.1. Company Overview
      2. 7.15.2. Product/Service Portfolio
      3. 7.15.3. Compac Sorting Equipment Sales, Revenue, and Gross Margin
      4. 7.15.4. Compac Sorting Equipment Revenue and Growth Rate
      5. 7.15.5. Compac Sorting Equipment Market Share
      6. 7.15.6. Recent Initiatives, Funding/VC Activities, and Technological Innovations
    16. 7.16. Agco Corporation
      1. 7.16.1. Company Overview
      2. 7.16.2. Product/Service Portfolio
      3. 7.16.3. Agco Corporation Sales, Revenue, and Gross Margin
      4. 7.16.4. Agco Corporation Revenue and Growth Rate
      5. 7.16.5. Agco Corporation Market Share
      6. 7.16.6. Recent Initiatives, Funding/VC Activities, and Technological Innovations
    17. 7.17. National Recovery Technologies, Llc
      1. 7.17.1. Company Overview
      2. 7.17.2. Product/Service Portfolio
      3. 7.17.3. National Recovery Technologies, Llc Sales, Revenue, and Gross Margin
      4. 7.17.4. National Recovery Technologies, Llc Revenue and Growth Rate
      5. 7.17.5. National Recovery Technologies, Llc Market Share
      6. 7.17.6. Recent Initiatives, Funding/VC Activities, and Technological Innovations
    18. 7.18. Max-Ai
      1. 7.18.1. Company Overview
      2. 7.18.2. Product/Service Portfolio
      3. 7.18.3. Max-Ai Sales, Revenue, and Gross Margin
      4. 7.18.4. Max-Ai Revenue and Growth Rate
      5. 7.18.5. Max-Ai Market Share
      6. 7.18.6. Recent Initiatives, Funding/VC Activities, and Technological Innovations
    19. 7.19. QualySense AG
      1. 7.19.1. Company Overview
      2. 7.19.2. Product/Service Portfolio
      3. 7.19.3. QualySense AG Sales, Revenue, and Gross Margin
      4. 7.19.4. QualySense AG Revenue and Growth Rate
      5. 7.19.5. QualySense AG Market Share
      6. 7.19.6. Recent Initiatives, Funding/VC Activities, and Technological Innovations
    20. 7.20. Bratney Companies
      1. 7.20.1. Company Overview
      2. 7.20.2. Product/Service Portfolio
      3. 7.20.3. Bratney Companies Sales, Revenue, and Gross Margin
      4. 7.20.4. Bratney Companies Revenue and Growth Rate
      5. 7.20.5. Bratney Companies Market Share
      6. 7.20.6. Recent Initiatives, Funding/VC Activities, and Technological Innovations
    21. 7.21. BoMill AB
      1. 7.21.1. Company Overview
      2. 7.21.2. Product/Service Portfolio
      3. 7.21.3. BoMill AB Sales, Revenue, and Gross Margin
      4. 7.21.4. BoMill AB Revenue and Growth Rate
      5. 7.21.5. BoMill AB Market Share
      6. 7.21.6. Recent Initiatives, Funding/VC Activities, and Technological Innovations
    22. 7.22. Milltec Clarfai, Inc.
      1. 7.22.1. Company Overview
      2. 7.22.2. Product/Service Portfolio
      3. 7.22.3. Milltec Clarfai, Inc. Sales, Revenue, and Gross Margin
      4. 7.22.4. Milltec Clarfai, Inc. Revenue and Growth Rate
      5. 7.22.5. Milltec Clarfai, Inc. Market Share
      6. 7.22.6. Recent Initiatives, Funding/VC Activities, and Technological Innovations
    23. 7.23. BBC technologies
      1. 7.23.1. Company Overview
      2. 7.23.2. Product/Service Portfolio
      3. 7.23.3. BBC technologies Sales, Revenue, and Gross Margin
      4. 7.23.4. BBC technologies Revenue and Growth Rate
      5. 7.23.5. BBC technologies Market Share
      6. 7.23.6. Recent Initiatives, Funding/VC Activities, and Technological Innovations
    24. 7.24. INTELLIGENTX Brewing Co.
      1. 7.24.1. Company Overview
      2. 7.24.2. Product/Service Portfolio
      3. 7.24.3. INTELLIGENTX Brewing Co. Sales, Revenue, and Gross Margin
      4. 7.24.4. INTELLIGENTX Brewing Co. Revenue and Growth Rate
      5. 7.24.5. INTELLIGENTX Brewing Co. Market Share
      6. 7.24.6. Recent Initiatives, Funding/VC Activities, and Technological Innovations
  8. Chapter 8 Artificial Intelligence (AI) in Food and Beverages — Industry Analysis
    1. 8.1. Introduction and Taxonomy
    2. 8.2. Artificial Intelligence (AI) in Food and Beverages Market – Key Trends
      1. 8.2.1. Market Drivers
      2. 8.2.2. Market Restraints
      3. 8.2.3. Market Opportunities
    3. 8.3. Value Chain Analysis
    4. 8.4. Key Mandates and Regulations
    5. 8.5. Technology Roadmap and Timeline
    6. 8.6. Artificial Intelligence (AI) in Food and Beverages Market – Attractiveness Analysis
      1. 8.6.1. By Organization Size
      2. 8.6.2. By Application
      3. 8.6.3. By End-Use Industry
      4. 8.6.4. By Region
  9. Chapter 9 Industrial Chain, Sourcing Strategy, and Downstream Buyers
    1. 9.1. Artificial Intelligence (AI) in Food and Beverages Industrial Chain Analysis
    2. 9.2. Downstream Buyers
    3. 9.3. Distributors/Traders List
  10. Chapter 10 Marketing Strategy Analysis
    1. 10.1. Marketing Channel
    2. 10.2. Direct Marketing
    3. 10.3. Indirect Marketing
    4. 10.4. Marketing Channel Development Trends
    5. 10.5. Economic/Political Environmental Change
  11. Chapter 11 Report Conclusion & Key Insights
    1. 11.1. Key Insights from Primary Interviews & Surveys Respondents
    2. 11.2. Key Takeaways from Analysts, Consultants, and Industry Leaders
  12. Chapter 12 Research Approach & Methodology
    1. 12.1. Report Description
    2. 12.2. Research Scope
    3. 12.3. Research Methodology
      1. 12.3.1. Secondary Research
      2. 12.3.2. Primary Research
      3. 12.3.3. Statistical Models
        1. 12.3.3.1. Company Share Analysis Model
        2. 12.3.3.2. Revenue Based Modeling
      4. 12.3.4. Research Limitations

      List of Figures

      Fig.1	Product Picture of Artificial Intelligence (AI) in Food and Beverages
      Fig.2	Global Artificial Intelligence (AI) in Food and Beverages Market, 2016 – 2026 (USD Million)
      Fig.3	Global Artificial Intelligence (AI) in Food and Beverages Market Absolute Revenue Opportunity, 2016 – 2026 (USD Million)
      Fig.4	Global Artificial Intelligence (AI) in Food and Beverages Market Incremental Revenue Opportunity, 2020 – 2026 (USD Million)
      Fig.5	Global Artificial Intelligence (AI) in Food and Beverages Market Share, by Organization Size, 2020 & 2026 (USD Million)
      Fig.6	Global Small Artificial Intelligence (AI) in Food and Beverages Market, 2016 – 2026 (USD Million)
      Fig.7	Global Medium & Large Enterprises Artificial Intelligence (AI) in Food and Beverages Market, 2016 – 2026 (USD Million)
      Fig.8	Global Artificial Intelligence (AI) in Food and Beverages Market Share, by Application, 2020 & 2026 (USD Million)
      Fig.9	Global Food Sorting Artificial Intelligence (AI) in Food and Beverages Market, 2016 – 2026 (USD Million)
      Fig.10	Global Quality Control and Safety Compliance Artificial Intelligence (AI) in Food and Beverages Market, 2016 – 2026 (USD Million)
      Fig.11	Global Consumer Engagement Artificial Intelligence (AI) in Food and Beverages Market, 2016 – 2026 (USD Million)
      Fig.12	Global Production and Packaging Artificial Intelligence (AI) in Food and Beverages Market, 2016 – 2026 (USD Million)
      Fig.13	Global Maintenance Artificial Intelligence (AI) in Food and Beverages Market, 2016 – 2026 (USD Million)
      Fig.14	Global Other Applications Artificial Intelligence (AI) in Food and Beverages Market, 2016 – 2026 (USD Million)
      Fig.15	Global Artificial Intelligence (AI) in Food and Beverages Market Share, by End-Use Industry, 2020 & 2026 (USD Million)
      Fig.16	Global Food Processing Artificial Intelligence (AI) in Food and Beverages Market, 2016 – 2026 (USD Million)
      Fig.17	Global Grocery Artificial Intelligence (AI) in Food and Beverages Market, 2016 – 2026 (USD Million)
      Fig.18	Global Hotels & Beverages Industry Artificial Intelligence (AI) in Food and Beverages Market, 2016 – 2026 (USD Million)
      Fig.19	Global Others Artificial Intelligence (AI) in Food and Beverages Market, 2016 – 2026 (USD Million)
      Fig.20	Global Artificial Intelligence (AI) in Food and Beverages Market Share, by Region, 2020 & 2026 (USD Million)
      Fig.21	North America Artificial Intelligence (AI) in Food and Beverages Market, 2016 – 2026 (USD Million)
      Fig.22	U.S. Artificial Intelligence (AI) in Food and Beverages Market, 2016 – 2026 (USD Million)
      Fig.23	Canada Artificial Intelligence (AI) in Food and Beverages Market, 2016 – 2026 (USD Million)
      Fig.24	Europe Artificial Intelligence (AI) in Food and Beverages Market, 2016 – 2026 (USD Million)
      Fig.25	Germany Artificial Intelligence (AI) in Food and Beverages Market, 2016 – 2026 (USD Million)
      Fig.26	France Artificial Intelligence (AI) in Food and Beverages Market, 2016 – 2026 (USD Million)
      Fig.27	U.K. Artificial Intelligence (AI) in Food and Beverages Market, 2016 – 2026 (USD Million)
      Fig.28	Italy Artificial Intelligence (AI) in Food and Beverages Market, 2016 – 2026 (USD Million)
      Fig.29	Spain Artificial Intelligence (AI) in Food and Beverages Market, 2016 – 2026 (USD Million)
      Fig.30	Rest of Europe Artificial Intelligence (AI) in Food and Beverages Market, 2016 – 2026 (USD Million)
      Fig.31	Asia Pacific Artificial Intelligence (AI) in Food and Beverages Market, 2016 – 2026 (USD Million)
      Fig.32	China Artificial Intelligence (AI) in Food and Beverages Market, 2016 – 2026 (USD Million)
      Fig.33	Japan Artificial Intelligence (AI) in Food and Beverages Market, 2016 – 2026 (USD Million)
      Fig.34	India Artificial Intelligence (AI) in Food and Beverages Market, 2016 – 2026 (USD Million)
      Fig.35	South  Korea Artificial Intelligence (AI) in Food and Beverages Market, 2016 – 2026 (USD Million)
      Fig.36	South-East Asia Artificial Intelligence (AI) in Food and Beverages Market, 2016 – 2026 (USD Million)
      Fig.37	Rest of Asia Pacific Artificial Intelligence (AI) in Food and Beverages Market, 2016 – 2026 (USD Million)
      Fig.38	Latin America Artificial Intelligence (AI) in Food and Beverages Market, 2016 – 2026 (USD Million)
      Fig.39	Brazil Artificial Intelligence (AI) in Food and Beverages Market, 2016 – 2026 (USD Million)
      Fig.40	Mexico Artificial Intelligence (AI) in Food and Beverages Market, 2016 – 2026 (USD Million)
      Fig.41	Rest of Latin America Artificial Intelligence (AI) in Food and Beverages Market, 2016 – 2026 (USD Million)
      Fig.42	The Middle-East and Africa Artificial Intelligence (AI) in Food and Beverages Market, 2016 – 2026 (USD Million)
      Fig.43	GCC Countries Artificial Intelligence (AI) in Food and Beverages Market, 2016 – 2026 (USD Million)
      Fig.44	South Africa Artificial Intelligence (AI) in Food and Beverages Market, 2016 – 2026 (USD Million)
      Fig.45	Rest of Middle-East Africa Artificial Intelligence (AI) in Food and Beverages Market, 2016 – 2026 (USD Million)
      Fig.46	Competitor Market Share – Revenue
      Fig.47	Rockwell Automation, Inc. Revenue and Growth Rate
      Fig.48	Rockwell Automation, Inc. Market Share
      Fig.49	Raytec Vision SpA Revenue and Growth Rate
      Fig.50	Raytec Vision SpA Market Share
      Fig.51	ABB Ltd. Revenue and Growth Rate
      Fig.52	ABB Ltd. Market Share
      Fig.53	Honeywell International, Inc. Revenue and Growth Rate
      Fig.54	Honeywell International, Inc. Market Share
      Fig.55	Duravant LLC Revenue and Growth Rate
      Fig.56	Duravant LLC Market Share
      Fig.57	TOMRA Systems Revenue and Growth Rate
      Fig.58	TOMRA Systems Market Share
      Fig.59	GREEFA Revenue and Growth Rate
      Fig.60	GREEFA Market Share
      Fig.61	Sesotec GmbH Revenue and Growth Rate
      Fig.62	Sesotec GmbH Market Share
      Fig.63	Martec Of Whitwell Ltd. Revenue and Growth Rate
      Fig.64	Martec Of Whitwell Ltd. Market Share
      Fig.65	Buhler Holding AG Revenue and Growth Rate
      Fig.66	Buhler Holding AG Market Share
      Fig.67	Key Technology Inc. Revenue and Growth Rate
      Fig.68	Key Technology Inc. Market Share
      Fig.69	Sight Machine Inc Revenue and Growth Rate
      Fig.70	Sight Machine Inc Market Share
      Fig.71	Foodable Network, LLC Revenue and Growth Rate
      Fig.72	Foodable Network, LLC Market Share
      Fig.73	Startup Creator Revenue and Growth Rate
      Fig.74	Startup Creator Market Share
      Fig.75	Compac Sorting Equipment Revenue and Growth Rate
      Fig.76	Compac Sorting Equipment Market Share
      Fig.77	Agco Corporation Revenue and Growth Rate
      Fig.78	Agco Corporation Market Share
      Fig.79	National Recovery Technologies, Llc Revenue and Growth Rate
      Fig.80	National Recovery Technologies, Llc Market Share
      Fig.81	Max-Ai Revenue and Growth Rate
      Fig.82	Max-Ai Market Share
      Fig.83	QualySense AG Revenue and Growth Rate
      Fig.84	QualySense AG Market Share
      Fig.85	Bratney Companies Revenue and Growth Rate
      Fig.86	Bratney Companies Market Share
      Fig.87	BoMill AB Revenue and Growth Rate
      Fig.88	BoMill AB Market Share
      Fig.89	Milltec  Clarfai, Inc. Revenue and Growth Rate
      Fig.90	Milltec  Clarfai, Inc. Market Share
      Fig.91	BBC technologies Revenue and Growth Rate
      Fig.92	BBC technologies Market Share
      Fig.93	INTELLIGENTX Brewing Co. Revenue and Growth Rate
      Fig.94	INTELLIGENTX Brewing Co. Market Share
      Fig.95	Market Dynamics
      Fig.96	Global Artificial Intelligence (AI) in Food and Beverages – Value Chain Analysis
      Fig.97	Key Mandates and Regulations
      Fig.98	Technology Roadmap and Timeline
      Fig.99	Market Attractiveness Analysis – By Organization Size
      Fig.100	Market Attractiveness Analysis – By Application
      Fig.101	Market Attractiveness Analysis – By End-Use Industry
      Fig.102	Market Attractiveness Analysis – By Region
      Fig.103	Artificial Intelligence (AI) in Food and Beverages Industrial Chain Analysis
      Fig.104	Market Channels
      Fig.105	Marketing Channel Development Trend
      Fig.106	Growth in World Gross Product, 2008-2018
      

      List of Tables

      Table 1	Global Artificial Intelligence (AI) in Food and Beverages Market, 2020 & 2026 (USD Million)
      Table 2	Global Artificial Intelligence (AI) in Food and Beverages Market, by Organization Size, 2016 – 2026 (USD Million)
      Table 3	Global Artificial Intelligence (AI) in Food and Beverages Market, by Application, 2016 – 2026 (USD Million)
      Table 4	Global Artificial Intelligence (AI) in Food and Beverages Market, by End-Use Industry, 2016 – 2026 (USD Million)
      Table 5	Global Artificial Intelligence (AI) in Food and Beverages Market, by Region, 2016 – 2026 (USD Million)
      Table 6	North America Artificial Intelligence (AI) in Food and Beverages Market, by Country, 2016 – 2026 (USD Million)
      Table 7	North America Artificial Intelligence (AI) in Food and Beverages Market, by Organization Size, 2016 – 2026 (USD Million)
      Table 8	North America Artificial Intelligence (AI) in Food and Beverages Market, by Application, 2016 – 2026 (USD Million)
      Table 9	North America Artificial Intelligence (AI) in Food and Beverages Market, by End-Use Industry, 2016 – 2026 (USD Million)
      Table 10 Europe Artificial Intelligence (AI) in Food and Beverages Market, by Country, 2016 – 2026 (USD Million)
      Table 11 Europe Artificial Intelligence (AI) in Food and Beverages Market, by Organization Size, 2016 – 2026 (USD Million)
      Table 12 Europe Artificial Intelligence (AI) in Food and Beverages Market, by Application, 2016 – 2026 (USD Million)
      Table 13 Europe Artificial Intelligence (AI) in Food and Beverages Market, by End-Use Industry, 2016 – 2026 (USD Million)
      Table 14 Asia Pacific Artificial Intelligence (AI) in Food and Beverages Market, by Country, 2016 – 2026 (USD Million)
      Table 15 Asia Pacific Artificial Intelligence (AI) in Food and Beverages Market, by Organization Size, 2016 – 2026 (USD Million)
      Table 16 Asia Pacific Artificial Intelligence (AI) in Food and Beverages Market, by Application, 2016 – 2026 (USD Million)
      Table 17 Asia Pacific Artificial Intelligence (AI) in Food and Beverages Market, by End-Use Industry, 2016 – 2026 (USD Million)
      Table 18 Latin America Artificial Intelligence (AI) in Food and Beverages Market, by Country, 2016 – 2026 (USD Million)
      Table 19 Latin America Artificial Intelligence (AI) in Food and Beverages Market, by Organization Size, 2016 – 2026 (USD Million)
      Table 20 Latin America Artificial Intelligence (AI) in Food and Beverages Market, by Application, 2016 – 2026 (USD Million)
      Table 21 Latin America Artificial Intelligence (AI) in Food and Beverages Market, by End-Use Industry, 2016 – 2026 (USD Million)
      Table 22 The Middle-East and Africa Artificial Intelligence (AI) in Food and Beverages Market, by Country, 2016 – 2026 (USD Million)
      Table 23 The Middle-East and Africa Artificial Intelligence (AI) in Food and Beverages Market, by Organization Size, 2016 – 2026 (USD Million)
      Table 24 The Middle-East and Africa Artificial Intelligence (AI) in Food and Beverages Market, by Application, 2016 – 2026 (USD Million)
      Table 25 The Middle-East and Africa Artificial Intelligence (AI) in Food and Beverages Market, by End-Use Industry, 2016 – 2026 (USD Million)
      Table 26 Global Artificial Intelligence (AI) in Food and Beverages Market - Company Revenue Analysis, 2016 – 2019 (USD Million)
      Table 27 Global Artificial Intelligence (AI) in Food and Beverages Market - Company Revenue Share Analysis, 2016 – 2019 (%)
      Table 28 Acquisitions and Mergers
      Table 29 Market Drivers – Impact Analysis
      Table 30 Market Restraints
      Table 31 Market Opportunities
      Table 32 Major Buyers of Artificial Intelligence (AI) in Food and Beverages
      Table 33 Distributors/Traders of Artificial Intelligence (AI) in Food and Beverages by Region
      

Industry Major Market Players

  • ABB Ltd.
  • Agco Corporation
  • BBC technologies
  • BoMill AB
  • Bratney Companies
  • Buhler Holding AG
  • Compac Sorting Equipment
  • Duravant LLC
  • Foodable Network LLC
  • GREEFA
  • Honeywell International Inc.
  • INTELLIGENTX Brewing Co.
  • Key Technology Inc.
  • Martec Of Whitwell Ltd.
  • Max-Ai
  • MilltecClarfai Inc.
  • National Recovery Technologies Llc
  • QualySense AG
  • Raytec Vision SpA
  • Rockwell Automation Inc.
  • Sesotec GmbH Sight Machine Inc.
  • Startup Creator
  • TOMRA Systems