Search Market Research Report

Discover Our Latest Reports
Discover Our Featured Reports
Discover Top Selling Reports

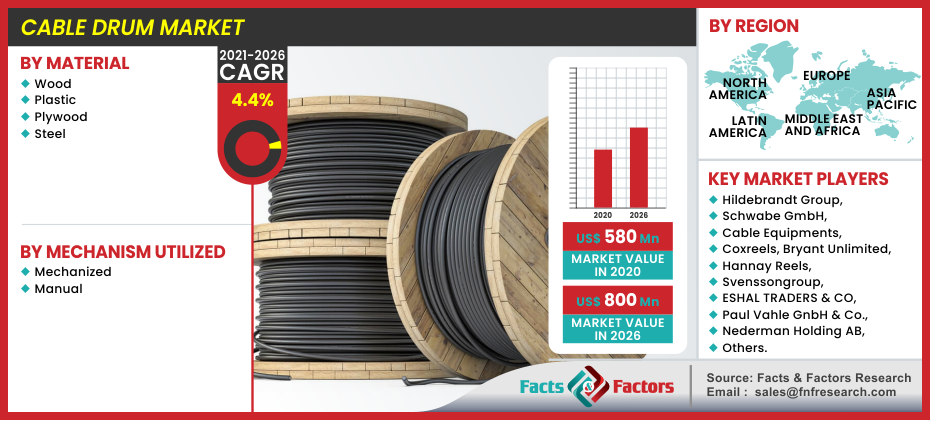
Cable Drum Market Size, Share Global Analysis Report, , 2020 – 2026

report img

Cable Drum Market By Material (Wood, Plastic, Plywood, and Steel), By Mechanism Utilized (Motorized & Manual), and By Regions - Global Industry Perspective, Comprehensive Analysis, and Forecast, 2020 – 2026

Industry Insights

[179+ Pages Report] As per the latest research and survey report issued by Facts and Factors, the global cable drum market was around USD 580 Million in 2020 and is expected to register revenues worth USD 800 Million by the end of 2026, growing at an exceptional CAGR of approximately 4.4% between 2021 and 2026.

logoMarket Overview

Cable drums are circular objects which carry different types of electrical conduits or fiber optic cables for transportation or storage purposes. A cable drum can be made up of different materials based on the application it is being utilized for. Typically, they are constructed from wood, plastic, plywood, and steel. The most common material used is wood and is prepared from resinous wood resins and is used in carrying heavier wires. Cable drums further make it an easy task to lay down tires without the fear of entanglement.

logoIndustry Growth Factors

Industrial automation often requires laying the huge groundwork of VFD cables for communication and power transmission means. The rapid automation and expansion of existing industrial measures drive the growth of the global cable drum market to a certain extent. Additionally, the advent of the latest advancements in mobile networks along with uptake of investments in private sector companies catering to the latter further propel the growth of the market. Cable Drum Market is further driven by a rise in demand for wires and cables utilized in various applications.

An increase in underground applications such as trams and electrification is seen as a rising trend for the rapid growth in the cable drum market. Increased demand for higher-speed internet and a boom in the telecommunication network further boosts the market. A rise in the need for transportation of wires to the designated sites also increases the need for cable drums. Other factors such as government spending, growing population in the urban areas, boosted FDIs, erection of commercial structures also contribute to the growth of the market. However, transportation costs and risks associated with the market hamper the growth to a certain extent.

Cable Drum Market

To know more about this report | Request Free Sample Copy

logoSegmentation Analysis

The global cable drum market can be segmented on the basis of material, mechanism utilized, and regions.

On the basis of material, the market can be divided into wooden, plywood, plastic, and steel. The steel-made cable drums account for the highest market share in the segment. Steel drums possess several features that make them a viable choice include retractable structure, high durability, less prone to being stolen, and their ability to remain intact during transit. On the basis of the mechanism utilized, the cable drum market can be broken down between mechanized and manual. The mechanized drums are expected to retain the highest market share in terms of revenue owing to shifting market standards across the globe. However, in terms of volume, the manual cable drums will absorb the majority of revenue with the highest growing CAGR.

logo Regional Analysis

The region of Europe will retain the highest market share during the forecast period. A distinct rise in manufacturing expansions and a general extension of several sectors such as automobile, equipment production, & power generation to name a few are quoted as the reason for the growth of the market in the region. However, the region of Asia-Pacific will witness the highest growth CAGR during the forecast. Asia-Pacific also boasts of the region which produces the highest volumes of electronic appliances and automobiles. This will give rise to a bigger footprint of the cable drum market in the region due to the higher demand for wires and cables. Other factors such as a straight rise of urbanization of areas leading to settlements of better industries and markets in the region also expected to drive the growth of cable drum markets in the region.

logoReport Scope

Report Attribute

Details

Market Size in 2020

USD 580 Million

Projected Market Size in 2026

USD 800 Million

CAGR Growth Rate

4.4 CAGR

Base Year

2020td>

Forecast Years

2021-2026

Key Market Players

Hildebrandt Group, Schwabe GmbH, Cable Equipments, Coxreels, Bryant Unlimited, Hannay Reels, Svenssongroup, ESHAL TRADERS & CO, Paul Vahle GnbH & Co., and Nederman Holding AB, among others.

Key Segment

By Material, By Mechanism Utilized , By Region

Major Regions Covered

North America, Europe, Asia Pacific, Latin America, and the Middle East & Africa

Purchase Options

Request customized purchase options to meet your research needs. Explore purchase options

logo Competitive Players

Some of the major participants in the global cable drum market are :

  • Hildebrandt Group
  • Schwabe GmbH
  • Cable Equipments
  • Coxreels
  • Bryant Unlimited
  • Hannay Reels
  • Svenssongroup
  • ESHAL TRADERS & CO
  • Paul Vahle GnbH & Co.
  • Nederman Holding AB

logo By Material Segment Analysis

  • Wood
  • Plastic
  • Plywood
  • Steel

logo By Mechanism Utilized Segment Analysis

  • Mechanized
  • Manual

logo By Regional Segment Analysis

  • North America
    • U.S.
    • Canada
  • Europe
    • UK
    • France
    • Germany
    • Italy
    • Spain
    • Rest of Europe
  • Asia Pacific
    • China
    • Japan
    • India
    • South Korea
    • Southeast Asia
    • Rest of Asia Pacific
  • Latin America
    • Brazil
    • Mexico
    • Rest of Latin America
  • Middle East and Africa
    • GCC Countries
    • South Africa
    • Rest of MEA

Table of Content

  1. Chapter 1 Executive Summary
    1. 1.1. Introduction of Cable Drum
    2. 1.2. Global Cable Drum Market, 2020 & 2026 (USD Million)
    3. 1.3. Global Cable Drum Market, 2016 – 2026 (USD Million)
    4. 1.4. Global Cable Drum Market Absolute Revenue Opportunity, 2016 – 2026 (USD Million)
    5. 1.5. Global Cable Drum Market Incremental Revenue Opportunity, 2020 – 2026 (USD Million)
  2. Chapter 2 Cable Drum Market – Material Analysis
    1. 2.1. Global Cable Drum Market – Material Overview
    2. 2.2. Global Cable Drum Market Share, by Material, 2020 & 2026 (USD Million)
    3. 2.3. Global Cable Drum Market share, by Material, 2020 & 2026
    4. 2.4. Wood
      1. 2.4.1. Global Wood Cable Drum Market, 2016 – 2026 (USD Million)
      2. 2.4.2. Global Wood Cable Drum Market, 2016 – 2026
    5. 2.5. Plastic
      1. 2.5.1. Global Plastic Cable Drum Market, 2016 – 2026 (USD Million)
      2. 2.5.2. Global Plastic Cable Drum Market, 2016 – 2026
    6. 2.6. Plywood
      1. 2.6.1. Global Plywood Cable Drum Market, 2016 – 2026 (USD Million)
      2. 2.6.2. Global Plywood Cable Drum Market, 2016 – 2026
    7. 2.7. Steel
      1. 2.7.1. Global Steel Cable Drum Market, 2016 – 2026 (USD Million)
      2. 2.7.2. Global Steel Cable Drum Market, 2016 – 2026
  3. Chapter 3 Cable Drum Market – Mechanism Utilized Analysis
    1. 3.1. Global Cable Drum Market – Mechanism Utilized Overview
    2. 3.2. Global Cable Drum Market Share, by Mechanism Utilized, 2020 & 2026 (USD Million)
    3. 3.3. Global Cable Drum Market share, by Mechanism Utilized, 2020 & 2026
    4. 3.4. Motorized
      1. 3.4.1. Global Motorized Cable Drum Market, 2016 – 2026 (USD Million)
      2. 3.4.2. Global Motorized Cable Drum Market, 2016 – 2026
    5. 3.5. Manual
      1. 3.5.1. Global Manual Cable Drum Market, 2016 – 2026 (USD Million)
      2. 3.5.2. Global Manual Cable Drum Market, 2016 – 2026
  4. Chapter 4 Cable Drum Market – Regional Analysis
    1. 4.1. Global Cable Drum Market Regional Overview
    2. 4.2. Global Cable Drum Market Share, by Region, 2020 & 2026 (USD Million)
    3. 4.3. Global Cable Drum Market Share, by Region, 2020 & 2026
    4. 4.4. North America
      1. 4.4.1. North America Cable Drum Market, 2016 – 2026 (USD Million)
        1. 4.4.1.1. North America Cable Drum Market, by Country, 2016 – 2026 (USD Million)
      2. 4.4.2. North America Market, 2016 – 2026
        1. 4.4.2.1. North America Cable Drum Market, by Country, 2016 – 2026
      3. 4.4.3. North America Cable Drum Market, by Material, 2016 – 2026
        1. 4.4.3.1. North America Cable Drum Market, by Material, 2016 – 2026 (USD Million)
        2. 4.4.3.2. North America Cable Drum Market, by Material, 2016 – 2026
      4. 4.4.4. North America Cable Drum Market, by Mechanism Utilized, 2016 – 2026
        1. 4.4.4.1. North America Cable Drum Market, by Mechanism Utilized, 2016 – 2026 (USD Million)
        2. 4.4.4.2. North America Cable Drum Market, by Mechanism Utilized, 2016 – 2026
      5. 4.4.5. U.S.
        1. 4.4.5.1. U.S. Cable Drum Market, 2016 – 2026 (USD Million)
        2. 4.4.5.2. U.S. Cable Drum Market, 2016 – 2026
      6. 4.4.6. Canada
        1. 4.4.6.1. Canada Cable Drum Market, 2016 – 2026 (USD Million)
        2. 4.4.6.2. Canada Cable Drum Market, 2016 – 2026
    5. 4.5. Europe
      1. 4.5.1. Europe Cable Drum Market, 2016 – 2026 (USD Million)
        1. 4.5.1.1. Europe Cable Drum Market, by Country, 2016 – 2026 (USD Million)
      2. 4.5.2. Europe Market, 2016 – 2026
        1. 4.5.2.1. Europe Cable Drum Market, by Country, 2016 – 2026
      3. 4.5.3. Europe Cable Drum Market, by Material, 2016 – 2026
        1. 4.5.3.1. Europe Cable Drum Market, by Material, 2016 – 2026 (USD Million)
        2. 4.5.3.2. Europe Cable Drum Market, by Material, 2016 – 2026
      4. 4.5.4. Europe Cable Drum Market, by Mechanism Utilized, 2016 – 2026
        1. 4.5.4.1. Europe Cable Drum Market, by Mechanism Utilized, 2016 – 2026 (USD Million)
        2. 4.5.4.2. Europe Cable Drum Market, by Mechanism Utilized, 2016 – 2026
      5. 4.5.5. Germany
        1. 4.5.5.1. Germany Cable Drum Market, 2016 – 2026 (USD Million)
        2. 4.5.5.2. Germany Cable Drum Market, 2016 – 2026
      6. 4.5.6. France
        1. 4.5.6.1. France Cable Drum Market, 2016 – 2026 (USD Million)
        2. 4.5.6.2. France Cable Drum Market, 2016 – 2026
      7. 4.5.7. U.K.
        1. 4.5.7.1. U.K. Cable Drum Market, 2016 – 2026 (USD Million)
        2. 4.5.7.2. U.K. Cable Drum Market, 2016 – 2026
      8. 4.5.8. Italy
        1. 4.5.8.1. Italy Cable Drum Market, 2016 – 2026 (USD Million)
        2. 4.5.8.2. Italy Cable Drum Market, 2016 – 2026
      9. 4.5.9. Spain
        1. 4.5.9.1. Spain Cable Drum Market, 2016 – 2026 (USD Million)
        2. 4.5.9.2. Spain Cable Drum Market, 2016 – 2026
      10. 4.5.10. Rest of Europe
        1. 4.5.10.1. Rest of Europe Cable Drum Market, 2016 – 2026 (USD Million)
        2. 4.5.10.2. Rest of Europe Cable Drum Market, 2016 – 2026
    6. 4.6. Asia Pacific
      1. 4.6.1. Asia Pacific Cable Drum Market, 2016 – 2026 (USD Million)
        1. 4.6.1.1. Asia Pacific Cable Drum Market, by Country, 2016 – 2026 (USD Million)
      2. 4.6.2. Asia Pacific Market, 2016 – 2026
        1. 4.6.2.1. Asia Pacific Cable Drum Market, by Country, 2016 – 2026
      3. 4.6.3. Asia Pacific Cable Drum Market, by Material, 2016 – 2026
        1. 4.6.3.1. Asia Pacific Cable Drum Market, by Material, 2016 – 2026 (USD Million)
        2. 4.6.3.2. Asia Pacific Cable Drum Market, by Material, 2016 – 2026
      4. 4.6.4. Asia Pacific Cable Drum Market, by Mechanism Utilized, 2016 – 2026
        1. 4.6.4.1. Asia Pacific Cable Drum Market, by Mechanism Utilized, 2016 – 2026 (USD Million)
        2. 4.6.4.2. Asia Pacific Cable Drum Market, by Mechanism Utilized, 2016 – 2026
      5. 4.6.5. China
        1. 4.6.5.1. China Cable Drum Market, 2016 – 2026 (USD Million)
        2. 4.6.5.2. China Cable Drum Market, 2016 – 2026
      6. 4.6.6. Japan
        1. 4.6.6.1. Japan Cable Drum Market, 2016 – 2026 (USD Million)
        2. 4.6.6.2. Japan Cable Drum Market, 2016 – 2026
      7. 4.6.7. India
        1. 4.6.7.1. India Cable Drum Market, 2016 – 2026 (USD Million)
        2. 4.6.7.2. India Cable Drum Market, 2016 – 2026
      8. 4.6.8. South Korea
        1. 4.6.8.1. South Korea Cable Drum Market, 2016 – 2026 (USD Million)
        2. 4.6.8.2. South Korea Cable Drum Market, 2016 – 2026
      9. 4.6.9. South-East Asia
        1. 4.6.9.1. South-East Asia Cable Drum Market, 2016 – 2026 (USD Million)
        2. 4.6.9.2. South-East Asia Cable Drum Market, 2016 – 2026
      10. 4.6.10. Rest of Asia Pacific
        1. 4.6.10.1. Rest of Asia Pacific Cable Drum Market, 2016 – 2026 (USD Million)
        2. 4.6.10.2. Rest of Asia Pacific Cable Drum Market, 2016 – 2026
    7. 4.7. Latin America
      1. 4.7.1. Latin America Cable Drum Market, 2016 – 2026 (USD Million)
        1. 4.7.1.1. Latin America Cable Drum Market, by Country, 2016 – 2026 (USD Million)
      2. 4.7.2. Latin America Market, 2016 – 2026
        1. 4.7.2.1. Latin America Cable Drum Market, by Country, 2016 – 2026
      3. 4.7.3. Latin America Cable Drum Market, by Material, 2016 – 2026
        1. 4.7.3.1. Latin America Cable Drum Market, by Material, 2016 – 2026 (USD Million)
        2. 4.7.3.2. Latin America Cable Drum Market, by Material, 2016 – 2026
      4. 4.7.4. Latin America Cable Drum Market, by Mechanism Utilized, 2016 – 2026
        1. 4.7.4.1. Latin America Cable Drum Market, by Mechanism Utilized, 2016 – 2026 (USD Million)
        2. 4.7.4.2. Latin America Cable Drum Market, by Mechanism Utilized, 2016 – 2026
      5. 4.7.5. Brazil
        1. 4.7.5.1. Brazil Cable Drum Market, 2016 – 2026 (USD Million)
        2. 4.7.5.2. Brazil Cable Drum Market, 2016 – 2026
      6. 4.7.6. Mexico
        1. 4.7.6.1. Mexico Cable Drum Market, 2016 – 2026 (USD Million)
        2. 4.7.6.2. Mexico Cable Drum Market, 2016 – 2026
      7. 4.7.7. Rest of Latin America
        1. 4.7.7.1. Rest of Latin America Cable Drum Market, 2016 – 2026 (USD Million)
        2. 4.7.7.2. Rest of Latin America Cable Drum Market, 2016 – 2026
    8. 4.8. The Middle-East and Africa
      1. 4.8.1. The Middle-East and Africa Cable Drum Market, 2016 – 2026 (USD Million)
        1. 4.8.1.1. The Middle-East and Africa Cable Drum Market, by Country, 2016 – 2026 (USD Million)
      2. 4.8.2. The Middle-East and Africa Market, 2016 – 2026
        1. 4.8.2.1. The Middle-East and Africa Cable Drum Market, by Country, 2016 – 2026
      3. 4.8.3. The Middle-East and Africa Cable Drum Market, by Material, 2016 – 2026
        1. 4.8.3.1. The Middle-East and Africa Cable Drum Market, by Material, 2016 – 2026 (USD Million)
        2. 4.8.3.2. The Middle-East and Africa Cable Drum Market, by Material, 2016 – 2026
      4. 4.8.4. The Middle-East and Africa Cable Drum Market, by Mechanism Utilized, 2016 – 2026
        1. 4.8.4.1. The Middle-East and Africa Cable Drum Market, by Mechanism Utilized, 2016 – 2026 (USD Million)
        2. 4.8.4.2. The Middle-East and Africa Cable Drum Market, by Mechanism Utilized, 2016 – 2026
      5. 4.8.5. GCC Countries
        1. 4.8.5.1. GCC Countries Cable Drum Market, 2016 – 2026 (USD Million)
        2. 4.8.5.2. GCC Countries Cable Drum Market, 2016 – 2026
      6. 4.8.6. South Africa
        1. 4.8.6.1. South Africa Cable Drum Market, 2016 – 2026 (USD Million)
        2. 4.8.6.2. South Africa Cable Drum Market, 2016 – 2026
      7. 4.8.7. Rest of Middle-East Africa
        1. 4.8.7.1. Rest of Middle-East Africa Cable Drum Market, 2016 – 2026 (USD Million)
        2. 4.8.7.2. Rest of Middle-East Africa Cable Drum Market, 2016 – 2026
  5. Chapter 5 Cable Drum Production, Consumption, Export, Import by Regions
    1. 5.1. Global Cable Drum Production and Consumption, 2016 – 2026
    2. 5.2. Global Import and Export Analysis, by Region
  6. Chapter 6 Cable Drum Market – Competitive Landscape
    1. 6.1. Competitor Market Share – Revenue
    2. 6.2. Market Concentration Rate Analysis, Top 3 and Top 5 Players
    3. 6.3. Competitor Market Share – Volume
    4. 6.4. Strategic Developments
      1. 6.4.1. Acquisitions and Mergers
      2. 6.4.2. New Products
      3. 6.4.3. Research & Development Activities
  7. Chapter 7 Company Profiles
    1. 7.1. Hildebrandt Group
      1. 7.1.1. Company Overview
      2. 7.1.2. Product/Service Portfolio
      3. 7.1.3. Hildebrandt Group Sales, Revenue, Price, and Gross Margin
      4. 7.1.4. Hildebrandt Group Revenue and Growth Rate
      5. 7.1.5. Hildebrandt Group Market Share
      6. 7.1.6. Recent Initiatives, Funding/VC Activities, and Technological Innovations
    2. 7.2. Schwabe GmbH
      1. 7.2.1. Company Overview
      2. 7.2.2. Product/Service Portfolio
      3. 7.2.3. Schwabe GmbH Sales, Revenue, Price, and Gross Margin
      4. 7.2.4. Schwabe GmbH Revenue and Growth Rate
      5. 7.2.5. Schwabe GmbH Market Share
      6. 7.2.6. Recent Initiatives, Funding/VC Activities, and Technological Innovations
    3. 7.3. Cable Equipments
      1. 7.3.1. Company Overview
      2. 7.3.2. Product/Service Portfolio
      3. 7.3.3. Cable Equipments Sales, Revenue, Price, and Gross Margin
      4. 7.3.4. Cable Equipments Revenue and Growth Rate
      5. 7.3.5. Cable Equipments Market Share
      6. 7.3.6. Recent Initiatives, Funding/VC Activities, and Technological Innovations
    4. 7.4. Coxreels
      1. 7.4.1. Company Overview
      2. 7.4.2. Product/Service Portfolio
      3. 7.4.3. Coxreels Sales, Revenue, Price, and Gross Margin
      4. 7.4.4. Coxreels Revenue and Growth Rate
      5. 7.4.5. Coxreels Market Share
      6. 7.4.6. Recent Initiatives, Funding/VC Activities, and Technological Innovations
    5. 7.5. Bryant Unlimited
      1. 7.5.1. Company Overview
      2. 7.5.2. Product/Service Portfolio
      3. 7.5.3. Bryant Unlimited Sales, Revenue, Price, and Gross Margin
      4. 7.5.4. Bryant Unlimited Revenue and Growth Rate
      5. 7.5.5. Bryant Unlimited Market Share
      6. 7.5.6. Recent Initiatives, Funding/VC Activities, and Technological Innovations
    6. 7.6. Hannay Reels
      1. 7.6.1. Company Overview
      2. 7.6.2. Product/Service Portfolio
      3. 7.6.3. Hannay Reels Sales, Revenue, Price, and Gross Margin
      4. 7.6.4. Hannay Reels Revenue and Growth Rate
      5. 7.6.5. Hannay Reels Market Share
      6. 7.6.6. Recent Initiatives, Funding/VC Activities, and Technological Innovations
    7. 7.7. Svenssongroup
      1. 7.7.1. Company Overview
      2. 7.7.2. Product/Service Portfolio
      3. 7.7.3. Svenssongroup Sales, Revenue, Price, and Gross Margin
      4. 7.7.4. Svenssongroup Revenue and Growth Rate
      5. 7.7.5. Svenssongroup Market Share
      6. 7.7.6. Recent Initiatives, Funding/VC Activities, and Technological Innovations
    8. 7.8. ESHAL TRADERS & CO
      1. 7.8.1. Company Overview
      2. 7.8.2. Product/Service Portfolio
      3. 7.8.3. ESHAL TRADERS & CO Sales, Revenue, Price, and Gross Margin
      4. 7.8.4. ESHAL TRADERS & CO Revenue and Growth Rate
      5. 7.8.5. ESHAL TRADERS & CO Market Share
      6. 7.8.6. Recent Initiatives, Funding/VC Activities, and Technological Innovations
    9. 7.9. Paul Vahle GnbH & Co.
      1. 7.9.1. Company Overview
      2. 7.9.2. Product/Service Portfolio
      3. 7.9.3. Paul Vahle GnbH & Co. Sales, Revenue, Price, and Gross Margin
      4. 7.9.4. Paul Vahle GnbH & Co. Revenue and Growth Rate
      5. 7.9.5. Paul Vahle GnbH & Co. Market Share
      6. 7.9.6. Recent Initiatives, Funding/VC Activities, and Technological Innovations
    10. 7.10. Nederman Holding AB
      1. 7.10.1. Company Overview
      2. 7.10.2. Product/Service Portfolio
      3. 7.10.3. Nederman Holding AB Sales, Revenue, Price, and Gross Margin
      4. 7.10.4. Nederman Holding AB Revenue and Growth Rate
      5. 7.10.5. Nederman Holding AB Market Share
      6. 7.10.6. Recent Initiatives, Funding/VC Activities, and Technological Innovations
    11. 7.11. Others
      1. 7.11.1. Company Overview
      2. 7.11.2. Product/Service Portfolio
      3. 7.11.3. Others Sales, Revenue, Price, and Gross Margin
      4. 7.11.4. Others Revenue and Growth Rate
      5. 7.11.5. Others Market Share
      6. 7.11.6. Recent Initiatives, Funding/VC Activities, and Technological Innovations
  8. Chapter 8 Cable Drum — Industry Analysis
    1. 8.1. Introduction and Taxonomy
    2. 8.2. Cable Drum Market – Key Trends
      1. 8.2.1. Market Drivers
      2. 8.2.2. Market Restraints
      3. 8.2.3. Market Opportunities
    3. 8.3. Value Chain Analysis
    4. 8.4. Key Mandates and Regulations
    5. 8.5. Technology Roadmap and Timeline
    6. 8.6. Cable Drum Market – Attractiveness Analysis
      1. 8.6.1. By Material
      2. 8.6.2. By Mechanism Utilized
      3. 8.6.3. By Region
  9. Chapter 9 Raw Material Analysis
    1. 9.1. Cable Drum Key Raw Material Analysis
      1. 9.1.1. Key Raw Materials
      2. 9.1.2. Price Trend of Key Raw Materials
    2. 9.2. Key Suppliers of Raw Materials
    3. 9.3. Proportion of Manufacturing Cost Structure
      1. 9.3.1. Raw Materials Cost
      2. 9.3.2. Labor Cost
      3. 9.3.3. Manufacturing Expenses
      4. 9.3.4. Miscellaneous Expenses
    4. 9.4. Manufacturing Cost Analysis of Cable Drum
  10. Chapter 10 Industrial Chain, Sourcing Strategy, and Downstream Buyers
    1. 10.1. Cable Drum Industrial Chain Analysis
    2. 10.2. Upstream Raw Materials Sourcing
      1. 10.2.1. Risk Mitigation:
      2. 10.2.2. Supplier Relationships:
      3. 10.2.3. Business Processes:
      4. 10.2.4. Securing the Product:
    3. 10.3. Raw Materials Sources of Cable Drum Major Manufacturers
    4. 10.4. Downstream Buyers
    5. 10.5. Distributors/Traders List
  11. Chapter 11 Marketing Strategy Analysis, Distributors
    1. 11.1. Marketing Channel
    2. 11.2. Direct Marketing
    3. 11.3. Indirect Marketing
    4. 11.4. Marketing Channel Development Trends
    5. 11.5. Economic/Political Environmental Change
  12. Chapter 12 Report Conclusion & Key Insights
    1. 12.1. Key Insights from Primary Interviews & Surveys Respondents
    2. 12.2. Key Takeaways from Analysts, Consultants, and Industry Leaders
  13. Chapter 13 Research Approach & Methodology
    1. 13.1. Report Description
    2. 13.2. Research Scope
    3. 13.3. Research Methodology
      1. 13.3.1. Secondary Research
      2. 13.3.2. Primary Research
      3. 13.3.3. Statistical Models
        1. 13.3.3.1. Company Share Analysis Model
        2. 13.3.3.2. Revenue Based Modeling
      4. 13.3.4. Research Limitations

      List of Figures

      Fig.1	Product Picture of Cable Drum
      Fig.2	Global Cable Drum Market, 2016 – 2026 (USD Million)
      Fig.3	Global Cable Drum Market, 2016 – 2026  
      Fig.4	Global Cable Drum Market Absolute Revenue Opportunity, 2016 – 2026 (USD Million)
      Fig.5	Global Cable Drum Market Incremental Revenue Opportunity, 2020 – 2026 (USD Million)
      Fig.6	Global Cable Drum Market Share, by Material, 2020 & 2026 (USD Million)
      Fig.7	Global Cable Drum Market Share, by Material, 2020 & 2026  
      Fig.8	Global Wood Cable Drum Market, 2016 – 2026 (USD Million)
      Fig.9	Global Wood Cable Drum Market, 2016 – 2026  
      Fig.10	Global Plastic Cable Drum Market, 2016 – 2026 (USD Million)
      Fig.11	Global Plastic Cable Drum Market, 2016 – 2026  
      Fig.12	Global Plywood Cable Drum Market, 2016 – 2026 (USD Million)
      Fig.13	Global Plywood Cable Drum Market, 2016 – 2026  
      Fig.14	Global Steel Cable Drum Market, 2016 – 2026 (USD Million)
      Fig.15	Global Steel Cable Drum Market, 2016 – 2026  
      Fig.16	Global Cable Drum Market Share, by Mechanism Utilized, 2020 & 2026 (USD Million)
      Fig.17	Global Cable Drum Market Share, by Mechanism Utilized, 2020 & 2026  
      Fig.18	Global Motorized Cable Drum Market, 2016 – 2026 (USD Million)
      Fig.19	Global Motorized Cable Drum Market, 2016 – 2026  
      Fig.20	Global Manual Cable Drum Market, 2016 – 2026 (USD Million)
      Fig.21	Global Manual Cable Drum Market, 2016 – 2026  
      Fig.22	Global Cable Drum Market Share, by Region, 2020 & 2026 (USD Million)
      Fig.23	Global Cable Drum Market Share, by Region, 2020 & 2026  
      Fig.24	North America Cable Drum Market, 2016 – 2026 (USD Million)
      Fig.25	North America Cable Drum Market, 2016 – 2026  
      Fig.26	U.S. Cable Drum Market, 2016 – 2026 (USD Million)
      Fig.27	U.S. Cable Drum  Market, 2016 – 2026  
      Fig.28	Canada Cable Drum Market, 2016 – 2026 (USD Million)
      Fig.29	Canada Cable Drum  Market, 2016 – 2026  
      Fig.30	Europe Cable Drum Market, 2016 – 2026 (USD Million)
      Fig.31	Europe Cable Drum Market, 2016 – 2026  
      Fig.32	Germany Cable Drum Market, 2016 – 2026 (USD Million)
      Fig.33	Germany Cable Drum  Market, 2016 – 2026  
      Fig.34	France Cable Drum Market, 2016 – 2026 (USD Million)
      Fig.35	France Cable Drum  Market, 2016 – 2026  
      Fig.36	U.K. Cable Drum Market, 2016 – 2026 (USD Million)
      Fig.37	U.K. Cable Drum  Market, 2016 – 2026  
      Fig.38	Italy Cable Drum Market, 2016 – 2026 (USD Million)
      Fig.39	Italy Cable Drum  Market, 2016 – 2026  
      Fig.40	Spain Cable Drum Market, 2016 – 2026 (USD Million)
      Fig.41	Spain Cable Drum  Market, 2016 – 2026  
      Fig.42	Rest of Europe Cable Drum Market, 2016 – 2026 (USD Million)
      Fig.43	Rest of Europe Cable Drum  Market, 2016 – 2026  
      Fig.44	Asia Pacific Cable Drum Market, 2016 – 2026 (USD Million)
      Fig.45	Asia Pacific Cable Drum Market, 2016 – 2026  
      Fig.46	China Cable Drum Market, 2016 – 2026 (USD Million)
      Fig.47	China Cable Drum  Market, 2016 – 2026  
      Fig.48	Japan Cable Drum Market, 2016 – 2026 (USD Million)
      Fig.49	Japan Cable Drum  Market, 2016 – 2026  
      Fig.50	India Cable Drum Market, 2016 – 2026 (USD Million)
      Fig.51	India Cable Drum  Market, 2016 – 2026  
      Fig.52	South  Korea Cable Drum Market, 2016 – 2026 (USD Million)
      Fig.53	South  Korea Cable Drum  Market, 2016 – 2026  
      Fig.54	South-East Asia Cable Drum Market, 2016 – 2026 (USD Million)
      Fig.55	South-East Asia Cable Drum  Market, 2016 – 2026  
      Fig.56	Rest of Asia Pacific Cable Drum Market, 2016 – 2026 (USD Million)
      Fig.57	Rest of Asia Pacific Cable Drum  Market, 2016 – 2026  
      Fig.58	Latin America Cable Drum Market, 2016 – 2026 (USD Million)
      Fig.59	Latin America Cable Drum Market, 2016 – 2026  
      Fig.60	Brazil Cable Drum Market, 2016 – 2026 (USD Million)
      Fig.61	Brazil Cable Drum  Market, 2016 – 2026  
      Fig.62	Mexico Cable Drum Market, 2016 – 2026 (USD Million)
      Fig.63	Mexico Cable Drum  Market, 2016 – 2026  
      Fig.64	Rest of Latin America Cable Drum Market, 2016 – 2026 (USD Million)
      Fig.65	Rest of Latin America Cable Drum  Market, 2016 – 2026  
      Fig.66	The Middle-East and Africa Cable Drum Market, 2016 – 2026 (USD Million)
      Fig.67	The Middle-East and Africa Cable Drum Market, 2016 – 2026  
      Fig.68	GCC Countries Cable Drum Market, 2016 – 2026 (USD Million)
      Fig.69	GCC Countries Cable Drum  Market, 2016 – 2026  
      Fig.70	South Africa Cable Drum Market, 2016 – 2026 (USD Million)
      Fig.71	South Africa Cable Drum  Market, 2016 – 2026  
      Fig.72	Rest of Middle-East Africa Cable Drum Market, 2016 – 2026 (USD Million)
      Fig.73	Rest of Middle-East Africa Cable Drum  Market, 2016 – 2026  
      Fig.74	Global Cable Drum Production and Consumption, 2016 – 2026  
      Fig.75	North America Cable Drum Production and Consumption, 2016 – 2026 (USD Million)  
      Fig.76	Europe Cable Drum Production and Consumption, 2016 – 2026 (USD Million)  
      Fig.77	Asia Pacific Cable Drum Production and Consumption, 2016 – 2026 (USD Million)  
      Fig.78	Latin America Cable Drum Production and Consumption, 2016 – 2026 (USD Million)  
      Fig.79	The Middle-East and Africa Cable Drum Production and Consumption, 2016 – 2026 (USD Million)  
      Fig.80	Competitor Market Share – Revenue
      Fig.81	Competitor Market Share – Volume
      Fig.82	Hildebrandt Group Revenue and Growth Rate
      Fig.83	Hildebrandt Group Market Share
      Fig.84	Schwabe GmbH Revenue and Growth Rate
      Fig.85	Schwabe GmbH Market Share
      Fig.86	Cable Equipments Revenue and Growth Rate
      Fig.87	Cable Equipments Market Share
      Fig.88	Coxreels Revenue and Growth Rate
      Fig.89	Coxreels Market Share
      Fig.90	Bryant Unlimited Revenue and Growth Rate
      Fig.91	Bryant Unlimited Market Share
      Fig.92	Hannay Reels Revenue and Growth Rate
      Fig.93	Hannay Reels Market Share
      Fig.94	Svenssongroup Revenue and Growth Rate
      Fig.95	Svenssongroup Market Share
      Fig.96	ESHAL TRADERS & CO Revenue and Growth Rate
      Fig.97	ESHAL TRADERS & CO Market Share
      Fig.98	Paul Vahle GnbH & Co. Revenue and Growth Rate
      Fig.99	Paul Vahle GnbH & Co. Market Share
      Fig.100	Nederman Holding AB Revenue and Growth Rate
      Fig.101	Nederman Holding AB Market Share
      Fig.102	Others Revenue and Growth Rate
      Fig.103	Others Market Share
      Fig.104	Market Dynamics
      Fig.105	Global Cable Drum – Value Chain Analysis
      Fig.106	Key Mandates and Regulations
      Fig.107	Technology Roadmap and Timeline
      Fig.108	Market Attractiveness Analysis – By Material
      Fig.109	Market Attractiveness Analysis – By Mechanism Utilized
      Fig.110	Market Attractiveness Analysis – By Region
      Fig.111	Manufacturing Cost Structure of Cable Drum
      Fig.112	Cable Drum Industrial Chain Analysis
      Fig.113	Market Channels
      Fig.114	Marketing Channel Development Trend
      Fig.115	Growth in World Gross Product, 2008-2018
      

      List of Tables

      Table 1	Global Cable Drum Market, 2020 & 2026 (USD Million)
      Table 2	Global Cable Drum Market, by Material, 2016 – 2026 (USD Million)
      Table 3	Global Cable Drum Market, by Material, 2016 – 2026  
      Table 4	Global Cable Drum Market, by Mechanism Utilized, 2016 – 2026 (USD Million)
      Table 5	Global Cable Drum Market, by Mechanism Utilized, 2016 – 2026  
      Table 6	Global Cable Drum Market, by Region, 2016 – 2026 (USD Million)
      Table 7	Global Cable Drum Market, by Region, 2016 – 2026  
      Table 8	North America Cable Drum Market, by Country, 2016 – 2026 (USD Million)
      Table 9 North America Cable Drum Market, by Country, 2016 – 2026  
      Table 10 North America Cable Drum Market, by Material, 2016 – 2026 (USD Million)
      Table 11 North America Cable Drum Market, by Material, 2016 – 2026  
      Table 12 North America Cable Drum Market, by Mechanism Utilized, 2016 – 2026 (USD Million)
      Table 13 North America Cable Drum Market, by Mechanism Utilized, 2016 – 2026  
      Table 14 Europe Cable Drum Market, by Country, 2016 – 2026 (USD Million)
      Table 15 Europe Cable Drum Market, by Country, 2016 – 2026  
      Table 16 Europe Cable Drum Market, by Material, 2016 – 2026 (USD Million)
      Table 17 Europe Cable Drum Market, by Material, 2016 – 2026  
      Table 18 Europe Cable Drum Market, by Mechanism Utilized, 2016 – 2026 (USD Million)
      Table 19 Europe Cable Drum Market, by Mechanism Utilized, 2016 – 2026  
      Table 20 Asia Pacific Cable Drum Market, by Country, 2016 – 2026 (USD Million)
      Table 21 Asia Pacific Cable Drum Market, by Country, 2016 – 2026  
      Table 22 Asia Pacific Cable Drum Market, by Material, 2016 – 2026 (USD Million)
      Table 23 Asia Pacific Cable Drum Market, by Material, 2016 – 2026  
      Table 24 Asia Pacific Cable Drum Market, by Mechanism Utilized, 2016 – 2026 (USD Million)
      Table 25 Asia Pacific Cable Drum Market, by Mechanism Utilized, 2016 – 2026  
      Table 26 Latin America Cable Drum Market, by Country, 2016 – 2026 (USD Million)
      Table 27 Latin America Cable Drum Market, by Country, 2016 – 2026  
      Table 28 Latin America Cable Drum Market, by Material, 2016 – 2026 (USD Million)
      Table 29 Latin America Cable Drum Market, by Material, 2016 – 2026  
      Table 30 Latin America Cable Drum Market, by Mechanism Utilized, 2016 – 2026 (USD Million)
      Table 31 Latin America Cable Drum Market, by Mechanism Utilized, 2016 – 2026  
      Table 32 The Middle-East and Africa Cable Drum Market, by Country, 2016 – 2026 (USD Million)
      Table 33 The Middle-East and Africa Cable Drum Market, by Country, 2016 – 2026  
      Table 34 The Middle-East and Africa Cable Drum Market, by Material, 2016 – 2026 (USD Million)
      Table 35 The Middle-East and Africa Cable Drum Market, by Material, 2016 – 2026  
      Table 36 The Middle-East and Africa Cable Drum Market, by Mechanism Utilized, 2016 – 2026 (USD Million)
      Table 37 The Middle-East and Africa Cable Drum Market, by Mechanism Utilized, 2016 – 2026  
      Table 38 North America Cable Drum Production, Consumption, Export, Import, 2016 – 2020
      Table 39 Europe Cable Drum Production, Consumption, Export, Import, 2016 – 2020
      Table 40 Asia Pacific Cable Drum Production, Consumption, Export, Import, 2016 – 2020
      Table 41 Latin America Cable Drum Production, Consumption, Export, Import, 2016 – 2020
      Table 42 The Middle-East and Africa Cable Drum Production, Consumption, Export, Import, 2016 – 2020
      Table 43 Global Cable Drum Market - Company Revenue Analysis, 2016 – 2019 (USD Million)
      Table 44 Global Cable Drum Market - Company Revenue Share Analysis, 2016 – 2019 (%)
      Table 45 Global Cable Drum Market - Company Volume Analysis, 2016 – 2020  
      Table 46 Global Cable Drum Market - Company Volume Share Analysis, 2016 – 2020 (%)
      Table 47 Acquisitions and Mergers
      Table 48 Market Drivers – Impact Analysis
      Table 49 Market Restraints
      Table 50 Market Opportunities
      Table 51 Production Base and Market Concentration Rate of Raw Material
      Table 52 Key Suppliers of Raw Materials
      Table 53 Raw Materials Sources of Cable Drum Major Manufacturers
      Table 54 Major Buyers of Cable Drum
      Table 55 Distributors/Traders of Cable Drum by Region
      

Industry Major Market Players

  • Hildebrandt Group
  • Schwabe GmbH
  • Cable Equipments
  • Coxreels
  • Bryant Unlimited
  • Hannay Reels
  • Svenssongroup
  • ESHAL TRADERS & CO
  • Paul Vahle GnbH & Co.
  • Nederman Holding AB