Search Market Research Report

Discover Our Latest Reports
Discover Our Featured Reports
Discover Top Selling Reports

Femtech Market Size, Share Global Analysis Report, 2019–2026

report img

Femtech Market By Solution (Diagnostics, Therapeutics, and Digital Health), By Application (Reproductive Health, Pelvic and Uterine Care, Pregnancy and Nursing Care, and General Wellness) and By End-User (Individuals, Hospitals, Diagnostics Centers, and Others): Global Industry Perspective, Market Size, Statistical Research, Market Intelligence, Comprehensive Analysis, Historical Trends, and Forecast 2019–2026

Industry Insights

This professional and specialized report study examines the technical and business perspective of the femtech industry. The report provides a historical analysis of the industry as well as the projected trends expected to be witnessed in the femtech market. The report study analyzes the market statistics at the global as well as regional levels to gain an in-depth perspective of the overall global femtech market.

The historical insights are provided from 2016 to 2019 and projected trends are provided from 2020 to 2026. The quantitative data is provided in terms of value (USD Million) for 2016 – 2026. The qualitative data is reinforced by analyzing and providing numerous market dynamics (directly or indirectly affecting the industry) such as growth drivers, restraints, challenges, and opportunities.

Femtech Market Size

To know more about this report | Request Free Sample Copy

logoKey Insights from Primary Research

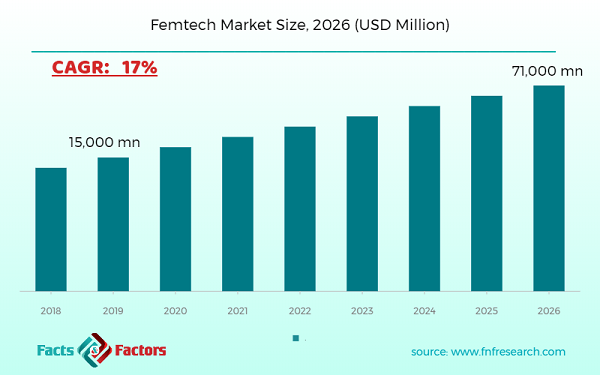
  • After detailed interviews with top healthcare industry executives, we estimated that the global market is expected to grow substantially by nearly 17% by the end of 2026.
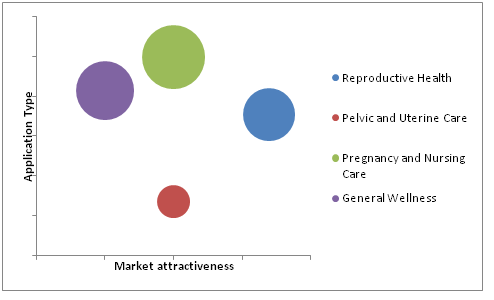
  • As per an online survey done by the FnF team, Pregnancy, and Nursing care is the most used application of femtech and is expected to grow at a CAGR of 16% from 2020 to 2026. 
  • The top researchers in the healthcare industry suggested focusing on smart tampons for monthly testing to collect biological samples. Such an innovation could help doctors in the early prediction of diseases such as ovarian cancer, larynx, etc.
  • Based on the observation on test marketing, our analyst predicted that the application of femtech for reproductive health is anticipated to bolster the global market with approximately 18% CAGR from 2020 to 2026. 
  • Through primary research, it was established that the femtech market was valued at around USD 18,500 million in 2019.
  • On the basis of end-users, the hospital category held the leading share of more than 43% in 2019. According to the end users of the femtech industry, the availability of resources such as emergency facilities, and skilled professionals are some of the prime reasons attracting them.

logoKey Recommendations from Analysts

  • The invention of new technology has led women in healthcare to become more realistic, highly invasive, and less intrusive, an overarching trend that has driven the femtech industry's growth. This development has led directly to the rapid adoption of various diagnostic instruments, resulting in the robust growth of femtech diagnostic products in the market.
  • Growing at a CAGR of around 17%, the digital health segment held the highest market share in the solution segment, the reason for this huge popularity is the ease of access to digital healthcare applications.
  •  According to the press release of various firms in 2019, Femtech start-ups raised about $75 billion in funding from investment firms.
  • According to our analysis, sensing lucrative opportunities for growth in the femtech market, compelling male-led companies are gradually focusing on women-oriented products.
  • Based on the data obtained through secondary research, our analysts have anticipated that the Asia Pacific is the fastest-growing region. The reason for this growth is the huge population residing in this region especially in China and India along with the rapid growth of the IT industry.

logoMarket Attractiveness – By Application

Global-Femtech-Market

To know more about this report | Request Free Sample Copy

We have included various industry analysis models in our report and extensively demonstrated the key business strategies and competitive landscape of the femtech market in our study.

Our study also includes an analysis of Porter’s Five Forces framework for understanding the competitive strategies adopted by various stakeholders involved in the entire value chain of the femtech market. It also encompasses PESTLE analysis and SWOT analysis.

The report also offers an in-depth analysis of the market shares of each industry player and gives an outline of the market position of key players in the femtech market. Moreover, the study offers wide coverage of key strategic advances witnessed in the market such as new product launches, acquisitions & mergers, collaborations & joint ventures, funding & VC activities, agreements, partnerships, R&D activities, and regional expansion of key players of the femtech market.

The research study provides a critical assessment of the femtech industry by logically segmenting the market on the basis of solutions, applications, end-user, and regions. Based on the past, present, and future trends, all the segments were analyzed from the bottom up, and the market sizes have been estimated from 2020 to 2026. The regional segmentation of the femtech industry includes the holistic bifurcation of all five major continents including North America, Europe, Asia Pacific, Latin America, and the Middle East & Africa.

The term femtech(female technology) is used for software, services, diagnostics, device, etc. dedicated to the well-being of women’s health. Its services include but are not limited to general well-being, pelvic and uterine care, reproductive health, pregnancy, and nursing care. Maternal care, pregnancy care, and Fertility are crucial areas for ladies with their later pregnancies. Digital communication, advanced medical technologies, and disruptive innovations have gradually become inseparable from providing best practices for the healthcare of pregnant women. The induction of new femtech solutions such as fertility tracking mobile applications and wearables has led to bolstering the demand for egg freezing, embryo screening, and other services.

Women are becoming much more aware of various applications related to feminine health. This trend in the sector of modern healthcare fueled the growth of the global femtech market. Key players operating in developed countries are heavily investing in software-enabled products. These huge investments in femtech avail lucrative opportunities across various topological regions, thereby accelerating the market growth over the forecast period.

The Femtech Market report is segmented based on solution, application, and end-user. Solution-wise, the market is classified into diagnostics, therapeutics, and digital health. In terms of application, the market segment is sectored into reproductive health, pelvic and uterine care, pregnancy and nursing care, and general wellness. On the basis of end-user, the market is bifurcated into individuals, hospitals, diagnostics centers, and others.

logoReport Scope

Report Attribute

Details

Market Size in 2019

USD 15,000 million

Projected Market Size in 2026

USD 71,000 million

CAGR Growth Rate

17% CAGR

Base Year

2019

Forecast Years

2019-2026

Key Market Players

Aparito, LactApp, SteadySense GmbH Inc., Bonzun, Elvie, NaturalCycles Nordic AB, Grace.health, Hera Med Ltd., iBreve Ltd., Bloomlife, Niramai Health Analytix Pvt Ltd, Pregnolia AG, Ava Science Inc.

Key Segment

By Solution, By Application, By End-User, By Region

Major Regions Covered

North America, Europe, Asia Pacific, Latin America, and the Middle East & Africa

Purchase Options

Request customized purchase options to meet your research needs. Explore purchase options

logoSome of the essential players operating in the femtech market, but not restricted to include: 

  • Aparito
  • Ava Science Inc.
  • Bloomlife Inc.
  • Bonzun
  • Elvie
  • Grace. health
  • Hera Med Ltd.
  • iBreve Ltd.
  • LactApp
  • NaturalCycles Nordic AB
  • Niramai Health Analytix Pvt Ltd
  • Pregnolia AG
  • SteadySense GmbH.

This report segments the Femtech market as follows:

logo By Solution Segmentation Analysis

  • Diagnostics
  • Therapeutics
  • Digital health

logo By Application Segmentation Analysis

  • Reproductive health
  • Pelvic and Uterine Care
  • Pregnancy and Nursing Care
  • General wellness

logo By End-User Segmentation Analysis

  • Individuals
  • Hospitals
  • Diagnostics Centers
  • Others.

logo Regional Segmentation Analysis

  • North America
    • The U.S.
    • Canada
  • Europe
    • Germany
    • France
    • UK
    • Italy
    • Spain
    • Rest of Europe
  • Asia Pacific
    • China
    • Japan
    • India
    • South Korea
    • South-East Asia
    • Rest of Asia Pacific
  • Latin America
    • Brazil
    • Mexico
    • Rest of Latin America
  • The Middle East and Africa
    • GCC Countries
    • South Africa
    • Rest of Middle-East Africa

logoKEY BUSINESS POINTERS ADDRESSED & FOREMOST REASONS TO PROCURE THE REPORT:

  • Statistical Analysis of the Past, Current, and Future Trends of the Industry with Validated Market Sizes Data
  • Direct and Indirect Rationales Impacting the Industry
  • In-depth and Micro Analysis of Viable Segments and Sub-segments
  • Companies and Vendors Market Share, Competitive Landscape, and Player Positioning Analysis
  • Demand Side (Consumption) and Supply Side (Production) Perspective and Analysis wherever applicable
  • Key Buyers and End-Users Analysis
  • Value Chain and Manufacturing Cost Structure Analysis wherever relevant
  • Key Marketing Strategies as well as Key Sales Channels adopted in the market
  • Investment Opportunity Analysis & Patents Analysis wherever feasible
  • Technological Road Map & Technical Analysis
  • Robust Research Methodology comprising a dynamic mix (65%~35%) of Extensive Primary Research (primary interviews, ad-hoc surveys, questionnaires) and Protracted Secondary Research (proprietary in-house database, paid external databases, publically available validated sources)

Table of Content

  1. CHAPTER 1. Executive Summary
  2. CHAPTER 2. Femtech market – Solution Analysis
    1. 2.1. Global Femtech Market – Solution Overview
    2. 2.2. Global Femtech Market Share, by Solution, 2019 & 2026 (USD Million)
    3. 2.3. Diagnostics
      1. 2.3.1. Global Diagnostics Femtech Market, 2016-2026 (USD Million)
    4. 2.4. Therapeutics
      1. 2.4.1. Global Therapeutics Femtech Market, 2016-2026 (USD Million)
    5. 2.5. Digital Health
      1. 2.5.1. Global Digital Health Femtech Market, 2016-2026 (USD Million)
  3. CHAPTER 3. Femtech market – Application Analysis
    1. 3.1. Global Femtech Market – Application Overview
    2. 3.2. Global Femtech Market Share, by Application, 2019 & 2026 (USD Million)
    3. 3.3. Reproductive Health
      1. 3.3.1. Global Reproductive Health Femtech Market, 2016-2026 (USD Million)
    4. 3.4. Pelvic and Uterine Care
      1. 3.4.1. Global Pelvic and Uterine Care Femtech Market, 2016-2026 (USD Million)
    5. 3.5. Pregnancy and Nursing Care
      1. 3.5.1. Global Pregnancy and Nursing Care Femtech Market, 2016-2026 (USD Million)
    6. 3.6. General Wellness
      1. 3.6.1. Global General Wellness Femtech Market, 2016-2026 (USD Million)
  4. CHAPTER 4. Femtech market – End-User Analysis
    1. 4.1. Global Femtech Market – End-User Overview
    2. 4.2. Global Femtech Market Share, by End-User, 2019 & 2026 (USD Million)
    3. 4.3. Individuals
      1. 4.3.1. Global Individuals Femtech Market, 2016-2026 (USD Million)
    4. 4.4. Hospitals
      1. 4.4.1. Global Hospitals Femtech Market, 2016-2026 (USD Million)
    5. 4.5. Diagnostics Centers
      1. 4.5.1. Global Diagnostics Centers Femtech Market, 2016-2026 (USD Million)
    6. 4.6. Others
      1. 4.6.1. Global Others Femtech Market, 2016-2026 (USD Million)
  5. CHAPTER 5. Femtech market – Regional Analysis
    1. 5.1. Global Femtech Market Regional Overview
    2. 5.2. Global Femtech Market Share, by Region, 2019 & 2026 (Value)
    3. 5.3. North America
      1. 5.3.1. North America Femtech Market size and forecast, 2016-2026
      2. 5.3.2. North America Femtech Market, by Country, 2019 & 2026 (USD Million)
      3. 5.3.3. North America Femtech Market, by Solution, 2016-2026
        1. 5.3.3.1. North America Femtech Market, by Solution, 2016-2026 (USD Million)
      4. 5.3.4. North America Femtech Market, by Application, 2016-2026
        1. 5.3.4.1. North America Femtech Market, by Application, 2016-2026 (USD Million)
      5. 5.3.5. North America Femtech Market, by End-User, 2016-2026
        1. 5.3.5.1. North America Femtech Market, by End-User, 2016-2026 (USD Million)
          1. 5.3.6. U.S.
            1. 5.3.6.1. U.S. Market size and forecast, 2016-2026 (USD Million)
      6. 5.3.7. Canada
        1. 5.3.7.1. Canada Market size and forecast, 2016-2026 (USD Million)
    4. 5.4. Europe
      1. 5.4.1. Europe Femtech Market size and forecast, 2016-2026
      2. 5.4.2. Europe Femtech Market, by Country, 2019 & 2026 (USD Million)
      3. 5.4.3. Europe Femtech Market, by Solution, 2016-2026
        1. 5.4.3.1. Europe Femtech Market, by Solution, 2016-2026 (USD Million)
      4. 5.4.4. Europe Femtech Market, by Application, 2016-2026
        1. 5.4.4.1. Europe Femtech Market, by Application, 2016-2026 (USD Million)
      5. 5.4.5. Europe Femtech Market, by End-User, 2016-2026
        1. 5.4.5.1. Europe Femtech Market, by End-User, 2016-2026 (USD Million)
      6. 5.4.6. Germany
        1. 5.4.6.1. Germany Market size and forecast, 2016-2026 (USD Million)
      7. 5.4.7. France
        1. 5.4.7.1. France Market size and forecast, 2016-2026 (USD Million)
          1. 5.4.8. U.K.
            1. 5.4.8.1. U.K. Market size and forecast, 2016-2026 (USD Million)
      8. 5.4.9. Italy
        1. 5.4.9.1. Italy Market size and forecast, 2016-2026 (USD Million)
      9. 5.4.10. Spain
        1. 5.4.10.1. Spain Market size and forecast, 2016-2026 (USD Million)
      10. 5.4.11. Rest of Europe
        1. 5.4.11.1. Rest of Europe Market size and forecast, 2016-2026 (USD Million)
    5. 5.5. Asia Pacific
      1. 5.5.1. Asia Pacific Femtech Market size and forecast, 2016-2026
      2. 5.5.2. Asia Pacific Femtech Market, by Country, 2019 & 2026 (USD Million)
      3. 5.5.3. Asia Pacific Femtech Market, by Solution, 2016-2026
        1. 5.5.3.1. Asia Pacific Femtech Market, by Solution, 2016-2026 (USD Million)
      4. 5.5.4. Asia Pacific Femtech Market, by Application, 2016-2026
        1. 5.5.4.1. Asia Pacific Femtech Market, by Application, 2016-2026 (USD Million)
      5. 5.5.5. Asia Pacific Femtech Market, by End-User, 2016-2026
        1. 5.5.5.1. Asia Pacific Femtech Market, by End-User, 2016-2026 (USD Million)
      6. 5.5.6. China
        1. 5.5.6.1. China Market size and forecast, 2016-2026 (USD Million)
      7. 5.5.7. Japan
        1. 5.5.7.1. Japan Market size and forecast, 2016-2026 (USD Million)
      8. 5.5.8. India
        1. 5.5.8.1. India Market size and forecast, 2016-2026 (USD Million)
      9. 5.5.9. South Korea
        1. 5.5.9.1. South Korea Market size and forecast, 2016-2026 (USD Million)
      10. 5.5.10. South-East Asia
        1. 5.5.10.1. South-East Asia Market size and forecast, 2016-2026 (USD Million)
      11. 5.5.11. Rest of Asia Pacific
        1. 5.5.11.1. Rest of Asia Pacific Market size and forecast, 2016-2026 (USD Million)
    6. 5.6. Latin America
      1. 5.6.1. Latin America Femtech Market size and forecast, 2016-2026
      2. 5.6.2. Latin America Femtech Market, by Country, 2019 & 2026 (USD Million)
      3. 5.6.3. Latin America Femtech Market, by Solution, 2016-2026
        1. 5.6.3.1. Latin America Femtech Market, by Solution, 2016-2026 (USD Million)
      4. 5.6.4. Latin America Femtech Market, by Application, 2016-2026
        1. 5.6.4.1. Latin America Femtech Market, by Application, 2016-2026 (USD Million)
      5. 5.6.5. Latin America Femtech Market, by End-User, 2016-2026
        1. 5.6.5.1. Latin America Femtech Market, by End-User, 2016-2026 (USD Million)
      6. 5.6.6. Brazil
        1. 5.6.6.1. Brazil Market size and forecast, 2016-2026 (USD Million)
      7. 5.6.7. Mexico
        1. 5.6.7.1. Mexico Market size and forecast, 2016-2026 (USD Million)
      8. 5.6.8. Rest of Latin America
        1. 5.6.8.1. Rest of Latin America Market size and forecast, 2016-2026 (USD Million)
    7. 5.7. The Middle-East and Africa
      1. 5.7.1. The Middle-East and Africa Femtech Market size and forecast, 2016-2026
      2. 5.7.2. The Middle-East and Africa Femtech Market, by Country, 2019 & 2026 (USD Million)
      3. 5.7.3. The Middle-East and Africa Femtech Market, by Solution, 2016-2026
        1. 5.7.3.1. The Middle-East and Africa Femtech Market, by Solution, 2016-2026 (USD Million)
      4. 5.7.4. The Middle-East and Africa Femtech Market, by Application, 2016-2026
        1. 5.7.4.1. The Middle-East and Africa Femtech Market, by Application, 2016-2026 (USD Million)
      5. 5.7.5. The Middle-East and Africa Femtech Market, by End-User, 2016-2026
        1. 5.7.5.1. The Middle-East and Africa Femtech Market, by End-User, 2016-2026 (USD Million)
      6. 5.7.6. GCC Countries
        1. 5.7.6.1. GCC Countries Market size and forecast, 2016-2026 (USD Million)
      7. 5.7.7. South Africa
        1. 5.7.7.1. South Africa Market size and forecast, 2016-2026 (USD Million)
      8. 5.7.8. Rest of Middle-East Africa
        1. 5.7.8.1. Rest of Middle-East Africa Market size and forecast, 2016-2026 (USD Million)
  6. CHAPTER 6. Femtech market – Competitive Landscape
    1. 6.1. Competitor Market Share – Revenue
    2. 6.2. Market Concentration Rate Analysis, Top 3 and Top 5 Players
    3. 6.3. Strategic Development
      1. 6.3.1. Acquisitions and Mergers
      2. 6.3.2. New Products
      3. 6.3.3. Research & Development Activities
  7. CHAPTER 7. Company Profiles
    1. 7.1. Aparito
      1. 7.1.1. Company Overview
      2. 7.1.2. Aparito Revenue and Gross Margin
      3. 7.1.3. Product portfolio
      4. 7.1.4. Recent initiatives
    2. 7.2. Ava Science Inc.
      1. 7.2.1. Company Overview
      2. 7.2.2. Ava Science Inc. Revenue and Gross Margin
      3. 7.2.3. Product portfolio
      4. 7.2.4. Recent initiatives
    3. 7.3. Bloomlife
      1. 7.3.1. Company Overview
      2. 7.3.2. Bloomlife Revenue and Gross Margin
      3. 7.3.3. Product portfolio
      4. 7.3.4. Recent initiatives
      5. 7.4. Inc.
      6. 7.4.1. Company Overview
        1. 7.4.2. Inc. Revenue and Gross Margin
      7. 7.4.3. Product portfolio
      8. 7.4.4. Recent initiatives
    4. 7.5. Bonzun
      1. 7.5.1. Company Overview
      2. 7.5.2. Bonzun Revenue and Gross Margin
      3. 7.5.3. Product portfolio
      4. 7.5.4. Recent initiatives
    5. 7.6. Elvie
      1. 7.6.1. Company Overview
      2. 7.6.2. Elvie Revenue and Gross Margin
      3. 7.6.3. Product portfolio
      4. 7.6.4. Recent initiatives
      5. 7.7. Grace.health
      6. 7.7.1. Company Overview
        1. 7.7.2. Grace.health Revenue and Gross Margin
      7. 7.7.3. Product portfolio
      8. 7.7.4. Recent initiatives
    6. 7.8. Hera Med Ltd.
      1. 7.8.1. Company Overview
      2. 7.8.2. Hera Med Ltd. Revenue and Gross Margin
      3. 7.8.3. Product portfolio
      4. 7.8.4. Recent initiatives
    7. 7.9. iBreve Ltd.
      1. 7.9.1. Company Overview
      2. 7.9.2. iBreve Ltd. Revenue and Gross Margin
      3. 7.9.3. Product portfolio
      4. 7.9.4. Recent initiatives
    8. 7.10. LactApp
      1. 7.10.1. Company Overview
      2. 7.10.2. LactApp Revenue and Gross Margin
      3. 7.10.3. Product portfolio
      4. 7.10.4. Recent initiatives
    9. 7.11. NaturalCycles Nordic AB
      1. 7.11.1. Company Overview
      2. 7.11.2. NaturalCycles Nordic AB Revenue and Gross Margin
      3. 7.11.3. Product portfolio
      4. 7.11.4. Recent initiatives
    10. 7.12. Niramai Health Analytix Pvt Ltd
      1. 7.12.1. Company Overview
      2. 7.12.2. Niramai Health Analytix Pvt Ltd Revenue and Gross Margin
      3. 7.12.3. Product portfolio
      4. 7.12.4. Recent initiatives
    11. 7.13. Pregnolia AG
      1. 7.13.1. Company Overview
      2. 7.13.2. Pregnolia AG Revenue and Gross Margin
      3. 7.13.3. Product portfolio
      4. 7.13.4. Recent initiatives
    12. 7.14. SteadySense GmbH
      1. 7.14.1. Company Overview
      2. 7.14.2. SteadySense GmbH Revenue and Gross Margin
      3. 7.14.3. Product portfolio
      4. 7.14.4. Recent initiatives
  8. CHAPTER 8. Femtech — Industry Analysis
    1. 8.1. Femtech Market – Key Trends
      1. 8.1.1. Market Drivers
      2. 8.1.2. Market Restraints
      3. 8.1.3. Market Opportunities
    2. 8.2. Value Chain Analysis
    3. 8.3. Technology Roadmap and Timeline
    4. 8.4. Femtech Market – Attractiveness Analysis
      1. 8.4.1. By Solution
      2. 8.4.2. By Application
      3. 8.4.3. By End-User
      4. 8.4.4. By Region
  9. CHAPTER 9. Marketing Strategy Analysis, Distributors
    1. 9.1. Marketing Channel
    2. 9.2. Direct Marketing
    3. 9.3. Indirect Marketing
    4. 9.4. Marketing Channel Development Trend
    5. 9.5. Economic/Political Environmental Change
  10. CHAPTER 10. Report Conclusion
  11. CHAPTER 11. Research Approach & Methodology
    1. 11.1. Report Description
    2. 11.2. Research Scope
    3. 11.3. Research Methodology
      1. 11.3.1. Secondary Research
      2. 11.3.2. Primary Research
      3. 11.3.3. Models
        1. 11.3.3.1. Company Share Analysis Model
        2. 11.3.3.2. Revenue Based Modeling
        3. 11.3.3.3. Research Limitations

        List of Figures

        FIG. 1    Global Femtech Market, 2016-2026 (USD Million)
        FIG. 2    Global Femtech Market Share, by Solution, 2019 & 2026 (USD Million)
        FIG. 3    Global Diagnostics Femtech Market, 2016-2026 (USD Million)
        FIG. 4    Global Therapeutics Femtech Market, 2016-2026 (USD Million)
        FIG. 5    Global Digital Health Femtech Market, 2016-2026 (USD Million)
        FIG. 6    Global Femtech Market Share, by Application, 2019 & 2026 (USD Million)
        FIG. 7    Global Reproductive Health Femtech Market, 2016-2026 (USD Million)
        FIG. 8    Global Pelvic and Uterine Care Femtech Market, 2016-2026 (USD Million)
        FIG. 9    Global Pregnancy and Nursing Care Femtech Market, 2016-2026 (USD Million)
        FIG. 10    Global General Wellness Femtech Market, 2016-2026 (USD Million)
        FIG. 11    Global Femtech Market Share, by  End-User, 2019 & 2026 (USD Million)
        FIG. 12    Global Individuals Femtech Market, 2016-2026 (USD Million)
        FIG. 13    Global Hospitals Femtech Market, 2016-2026 (USD Million)
        FIG. 14    Global Diagnostics Centers Femtech Market, 2016-2026 (USD Million)
        FIG. 15    Global Others Femtech Market, 2016-2026 (USD Million)
        FIG. 16    Global Femtech Market Share, by Region, 2019 & 2026
        FIG. 17    North America Femtech Market, 2016-2026
        FIG. 18    U.S. Femtech Market, 2016-2026
        FIG. 19    Canada Femtech Market, 2016-2026
        FIG. 20    Europe Femtech Market, 2016-2026
        FIG. 21    Germany Femtech Market, 2016-2026
        FIG. 22    France Femtech Market, 2016-2026
        FIG. 23    U.K. Femtech Market, 2016-2026
        FIG. 24    Italy Femtech Market, 2016-2026
        FIG. 25    Spain Femtech Market, 2016-2026
        FIG. 26    Rest of Europe Femtech Market, 2016-2026
        FIG. 27    Asia Pacific Femtech Market, 2016-2026
        FIG. 28    China Femtech Market, 2016-2026
        FIG. 29    Japan Femtech Market, 2016-2026
        FIG. 30    India Femtech Market, 2016-2026
        FIG. 31    South  Korea Femtech Market, 2016-2026
        FIG. 32    South-East Asia Femtech Market, 2016-2026
        FIG. 33    Rest of Asia Pacific Femtech Market, 2016-2026
        FIG. 34    Latin America Femtech Market, 2016-2026
        FIG. 35    Brazil Femtech Market, 2016-2026
        FIG. 36    Mexico Femtech Market, 2016-2026
        FIG. 37    Rest of Latin America Femtech Market, 2016-2026
        FIG. 38    The Middle-East and Africa Femtech Market, 2016-2026
        FIG. 39    GCC Countries Femtech Market, 2016-2026
        FIG. 40    South Africa Femtech Market, 2016-2026
        FIG. 41    Rest of Middle-East Africa Femtech Market, 2016-2026
        FIG. 42    Competitor Market Share – Revenue
        FIG. 43    Aparito Revenue and Growth Rate
        FIG. 44    Aparito Market Share
        FIG. 45    Ava Science Inc. Revenue and Growth Rate
        FIG. 46    Ava Science Inc. Market Share
        FIG. 47    Bloomlife Revenue and Growth Rate
        FIG. 48    Bloomlife Market Share
        FIG. 49    Inc. Revenue and Growth Rate
        FIG. 50    Inc. Market Share
        FIG. 51    Bonzun Revenue and Growth Rate
        FIG. 52    Bonzun Market Share
        FIG. 53    Elvie Revenue and Growth Rate
        FIG. 54    Elvie Market Share
        FIG. 55    Grace.health Revenue and Growth Rate
        FIG. 56    Grace.health Market Share
        FIG. 57    Hera Med Ltd. Revenue and Growth Rate
        FIG. 58    Hera Med Ltd. Market Share
        FIG. 59    iBreve Ltd. Revenue and Growth Rate
        FIG. 60    iBreve Ltd. Market Share
        FIG. 61    LactApp Revenue and Growth Rate
        FIG. 62    LactApp Market Share
        FIG. 63    NaturalCycles Nordic AB Revenue and Growth Rate
        FIG. 64    NaturalCycles Nordic AB Market Share
        FIG. 65    Niramai Health Analytix Pvt Ltd Revenue and Growth Rate
        FIG. 66    Niramai Health Analytix Pvt Ltd Market Share
        FIG. 67    Pregnolia AG Revenue and Growth Rate
        FIG. 68    Pregnolia AG Market Share
        FIG. 69    SteadySense GmbH Revenue and Growth Rate
        FIG. 70    SteadySense GmbH Market Share
        FIG. 71    Market Dynamics
        FIG. 72    Global Femtech – Value Chain Analysis
        FIG. 73    Technology Roadmap and Timeline
        FIG. 74    Market Attractiveness Analysis – By Solution
        FIG. 75    Market Attractiveness Analysis – By Application
        FIG. 76    Market Attractiveness Analysis – By  End-User
        FIG. 77    Market Attractiveness Analysis – By Region
        FIG. 78    Market Channel
        FIG. 79    Marketing Channel Development Trend
        FIG. 80    Growth in World Gross Product, 2008-2019


        List of Tables

        TABLE 1    Global Femtech Market, 2019 & 2026 (USD Million)
        TABLE 2    Global Femtech market, by Solution, 2016-2026 (USD Million)
        TABLE 3    Global Femtech market, by Application, 2016-2026 (USD Million)
        TABLE 4    Global Femtech market, by  End-User, 2016-2026 (USD Million)
        TABLE 5    Global Femtech market, by Region, 2016-2026 (USD Million)
        TABLE 6    North America Femtech Market, by Solution, 2016-2026 (USD Million)
        TABLE 7    North America Femtech Market, by Application, 2016-2026 (USD Million)
        TABLE 8    North America Femtech Market, by  End-User, 2016-2026 (USD Million)
        TABLE 9    Europe Femtech Market, by Solution, 2016-2026 (USD Million)
        TABLE 10    Europe Femtech Market, by Application, 2016-2026 (USD Million)
        TABLE 11    Europe Femtech Market, by  End-User, 2016-2026 (USD Million)
        TABLE 12    Asia Pacific Femtech Market, by Solution, 2016-2026 (USD Million)
        TABLE 13    Asia Pacific Femtech Market, by Application, 2016-2026 (USD Million)
        TABLE 14    Asia Pacific Femtech Market, by  End-User, 2016-2026 (USD Million)
        TABLE 15    Latin America Femtech Market, by Solution, 2016-2026 (USD Million)
        TABLE 16    Latin America Femtech Market, by Application, 2016-2026 (USD Million)
        TABLE 17    Latin America Femtech Market, by  End-User, 2016-2026 (USD Million)
        TABLE 18    The Middle-East and Africa Femtech Market, by Solution, 2016-2026 (USD Million)
        TABLE 19    The Middle-East and Africa Femtech Market, by Application, 2016-2026 (USD Million)
        TABLE 20    The Middle-East and Africa Femtech Market, by  End-User, 2016-2026 (USD Million)
        TABLE 21    Global Femtech Market - Company Revenue Analysis 2016-2019 (USD Million)
        TABLE 22    Global Femtech Market - Company Revenue Share Analysis 2016-2019(%)
        TABLE 23    Acquisitions and Mergers
        TABLE 24    New Product/Service Launch
        TABLE 25    Research & Development Activities
        TABLE 26    Market Drivers
        TABLE 27    Market Restraints
        TABLE 28    Market Opportunities

Industry Major Market Players

  • Aparito
  • Ava Science Inc.
  • Bloomlife Inc.
  • Bonzun
  • Elvie
  • Grace.health
  • Hera Med Ltd.
  • iBreve Ltd.
  • LactApp
  • NaturalCycles Nordic AB
  • Niramai Health Analytix Pvt Ltd
  • Pregnolia AG
  • SteadySense GmbH.