Search Market Research Report

Discover Our Latest Reports
Discover Our Featured Reports
Discover Top Selling Reports

Non-Alcoholic Wine and Beer Market Size, Share Global Analysis Report, 2020–2026

report img

Non-Alcoholic Wine and Beer Market By Product (Beer and Wine), By Material (Grapes, Berries/ Apples, Malted Grains, Hops, Yeast, and Enzymes), By Type (Alcohol Free and Lower Alcohol), By Technology (Restricted Fermentation and Dealcoholization), By Sales Stores (Liquor Stores, Convenience Stores, Supermarkets, Online Stores, and Restaurants & Bar), and By Region: Global Industry Outlook, Market Size, Business Intelligence, Consumer Preferences, Statistical Surveys, Comprehensive Analysis, Historical Developments, Current Trends, and Forecast 2020–2026

Industry Insights

This specialized and expertise oriented industry research report scrutinizes the technical and commercial business outlook of the Non-Alcoholic Wine and Beer industry. The report analyzes and declares the historical and current trends analysis of the Non-Alcoholic Wine and Beer industry and subsequently recommends the projected trends anticipated to be observed in the global Non-Alcoholic Wine and Beer market during the upcoming years

Global Non-Alcoholic Wine and Beer Market Size

To know more about this report | Request Free Sample Copy

The global Non-Alcoholic Wine and Beer market report analyzes and notifies the industry statistics at the global as well as regional and country levels in order to acquire a thorough perspective of the entire Non-Alcoholic Wine and Beer market. The historical and past insights are provided for FY 2016 to FY 2019 whereas projected trends are delivered for FY 2020 to FY 2026. The quantitative and numerical data is represented in terms of both volume (Million Liters) and value (USD Billion) from FY 2016 – 2026.

The quantitative data is further underlined and reinforced by comprehensive qualitative data which comprises various across-the-board market dynamics. The rationales which directly or indirectly impact the Non-Alcoholic Wine and Beer industry are exemplified through parameters such as growth drivers, restraints, challenges, and opportunities among other impacting factors.

Throughout our research report, we have encompassed all the proven models and tools of industry analysis and extensively illustrated all the key business strategies and business models adopted in the Non-Alcoholic Wine and Beer industry. The report provides an all-inclusive and detailed competitive landscape prevalent in the global Non-Alcoholic Wine and Beer market.

The report utilizes established industry analysis tools and models such as Porter’s Five Forces framework to analyze and recognize critical business strategies adopted by various stakeholders involved in the entire value chain of the Non-Alcoholic Wine and Beer industry. The global Non-Alcoholic Wine and Beer market report additionally employs SWOT analysis and PESTLE analysis models for further in-depth analysis.

The report study further includes an in-depth analysis of industry players' market shares and provides an overview of leading players' market position in the Non-Alcoholic Wine and Beer sector. Key strategic developments in the global Non-Alcoholic Wine and Beer market competitive landscape such as acquisitions & mergers, inaugurations of different products and services, partnerships & joint ventures, MoU agreements, VC & funding activities, R&D activities, and geographic expansion among other noteworthy activities by key players of the global Non-Alcoholic Wine and Beer market are appropriately highlighted in the report.

Growing consumer demand for non-alcoholic beer and wine across the globe is likely to upsurge the market growth. Additionally, the rising awareness about health benefits of alcohol-free products coupled with the positive effects on blood pressure, heart, and bone will further escalate the Non-Alcoholic Wine and Beer market growth. The intensifying socialization, pressure of maintain social status as non-drinkers along with the high product availability is anticipated to boost the market growth. Moreover, the demand for alcohol-free beverages among the Islamic community will drive the global Non-Alcoholic Wine and Beer market during the forecast period. The liquor manufacturers trying to abide by the cultural prohibitions and the stringent rules & regulations related to alcohol consumption are projected to promulgate the market growth. The surging demand for low calories, aromatic, mouthfeel, and flavorful non-alcoholic beverages among the health conscious consumers will fuel the scope of the market.

The global Non-Alcoholic Wine and Beer market research report delivers an acute valuation and taxonomy of the Non-Alcoholic Wine and Beer industry by practically splitting the market on the basis of different product, material, type, technology, sales stores, and regions. Through the analysis of the historical and projected trends, all the segments and sub-segments were evaluated through the bottom-up approach, and different market sizes have been projected for FY 2020 to FY 2026. The regional segmentation of the Non-Alcoholic Wine and Beer industry includes the complete classification of all the major continents including North America, Latin America, Europe, Asia Pacific, and Middle East & Africa. Further, country-wise data for the Non-Alcoholic Wine and Beer industry is provided for the leading economies of the world.

logoReport Scope

Report Attribute

Details

Market Size in 2019

USD 21.5 Billion

Projected Market Size in 2026

USD 35.7 Billion

Growth Rate

CAGR 7.5%

Base Year

2019

Forecast Years

2020-2026

Key Market Players

Erdinger, Moscow Brewery Company,Carlsberg, Arpanoosh,Bayerische Staatsbrauerei Weihenstepha,Big Drop Brewing Co, Ltd., S. Martinelli & Company, Anheuser-Busch InBev, Iran Behnoush Co.,Burke Distribution Corporation,J. Lohr Vineyards & Wines, Kirin Holdings Company, Heineken N.V,Sutter Home Winery, Inc.,Coors Brewing Company, Halewood Wines & Spirits,Bernard Brewery, Pierre Chavin,Suntory Brewery Co., Ltd., and Krombacher Brauerei.

Key Segment

By Product, By Material, By Technology, By Sales Stores, By Region

Major Regions Covered

North America, Europe, Asia Pacific, Latin America, and the Middle East & Africa

Purchase Options

Request customized purchase options to meet your research needs. Explore purchase options

The global Non-Alcoholic Wine and Beer market is segmented based on Product, Material,Type, Technology, and Sales Stores. On the basis of product segmentation, the market is classified into Beer and Wine. By material, the global Non-Alcoholic Wine and Beer market is segmented intoGrapes, Berries/ Apples, Malted Grains, Hops, Yeast, Enzymes.In terms of type, the market for Non-Alcoholic Wine and Beer is divided into Alcohol Free and Lower Alcohol. Based ontechnology, the market is segregated into Restricted Fermentation and Dealcoholization. By sales stores, the Non-Alcoholic Wine and Beer market is categorized into Liquor Stores, Convenience Stores, Supermarkets, Online Stores, and Restaurants & Bar.

logoSome of the essential players operating in the global Non-Alcoholic Wine and Beer market, but not restricted to include

  • Erdinger
  • Moscow Brewery Company
  • Carlsberg
  • Arpanoosh
  • Bayerische Staatsbrauerei Weihenstepha
  • Big Drop Brewing Co Ltd.
  • S. Martinelli & Company
  • Anheuser-Busch InBev
  • Iran Behnoush Co.
  • Burke Distribution Corporation
  • J. Lohr Vineyards & Wines
  • Kirin Holdings Company
  • Heineken N.V
  • Sutter Home Winery Inc.
  • Coors Brewing Company
  • Halewood Wines & Spirits
  • Bernard Brewery
  • Pierre Chavin
  • Suntory Brewery Co. Ltd.
  • Krombacher Brauerei.

The taxonomy of the Non-Alcoholic Wine and Beer industry by its scope and segmentation is as follows:

logo Product Segmentation Analysis

  • Beer
  • Wine

logo Material Segmentation Analysis

  • Grapes
  • Berries/ Apples
  • Malted Grains
  • Hops
  • Yeast
  • Enzymes

logo Type Segmentation Analysis

  • Alcohol Free
  • Lower Alcohol

logo Technology Segmentation Analysis

  • Restricted Fermentation
  • Dealcoholization
    • Reverse Osmosis
    • Heat Treatment
    • Vacuum Distillation

logo Sales StoresSegmentation Analysis

  • Liquor Stores
  • Convenience Stores
  • Supermarkets
  • Online Stores
  • Restaurants & Bar

logo Regional Segmentation Analysis

  • North America
    • The U.S.
    • Canada
  • Europe
    • Germany
    • The UK
    • France
    • Spain
    • Italy
    • Rest of Europe
  • Asia Pacific
    • China
    • Japan
    • India
    • South Korea
    • Southeast Asia
    • Rest of Asia Pacific
  • Latin America
    • Brazil
    • Mexico
    • Rest of Latin America
  • Middle East & Africa
    • GCC
    • South Africa
    • Rest of Middle East & Africa

Table of Content

  1. CHAPTER 1. Executive Summary
  2. CHAPTER 2. Non-Alcoholic Wine and Beer market – Product Analysis
    1. 2.1. Global Non-Alcoholic Wine and Beer Market–ProductOverview
    2. 2.2. Global Non-Alcoholic Wine and BeerMarketShare, by Product, 2018 & 2025 (USD Billion)
    3. 2.3. Global Non-Alcoholic Wine and Beer Market share, by Product, 2018 & 2025 (Million Liters)
    4. 2.4. Beer
      1. 2.4.1. Global BeerNon-Alcoholic Wine and BeerMarket,2016-2026 (USD Billion)
      2. 2.4.2. Global BeerNon-Alcoholic Wine and Beer Market, 2016-2026 (Million Liters)
    5. 2.5. Wine
      1. 2.5.1. Global WineNon-Alcoholic Wine and BeerMarket,2016-2026 (USD Billion)
      2. 2.5.2. Global WineNon-Alcoholic Wine and Beer Market, 2016-2026 (Million Liters)
  3. CHAPTER 3. Non-Alcoholic Wine and Beer market – Material Analysis
    1. 3.1. Global Non-Alcoholic Wine and Beer Market–MaterialOverview
    2. 3.2. Global Non-Alcoholic Wine and BeerMarketShare, by Material, 2018 & 2025 (USD Billion)
    3. 3.3. Global Non-Alcoholic Wine and Beer Market share, by Material, 2018 & 2025 (Million Liters)
    4. 3.4. Grapes
      1. 3.4.1. Global GrapesNon-Alcoholic Wine and BeerMarket,2016-2026 (USD Billion)
      2. 3.4.2. Global GrapesNon-Alcoholic Wine and Beer Market, 2016-2026 (Million Liters)
    5. 3.5. Berries/ Apples
      1. 3.5.1. Global Berries/ ApplesNon-Alcoholic Wine and BeerMarket,2016-2026 (USD Billion)
      2. 3.5.2. Global Berries/ ApplesNon-Alcoholic Wine and Beer Market, 2016-2026 (Million Liters)
    6. 3.6. Malted Grains
      1. 3.6.1. Global Malted GrainsNon-Alcoholic Wine and BeerMarket,2016-2026 (USD Billion)
      2. 3.6.2. Global Malted GrainsNon-Alcoholic Wine and Beer Market, 2016-2026 (Million Liters)
    7. 3.7. Hops
      1. 3.7.1. Global HopsNon-Alcoholic Wine and BeerMarket,2016-2026 (USD Billion)
      2. 3.7.2. Global HopsNon-Alcoholic Wine and Beer Market, 2016-2026 (Million Liters)
    8. 3.8. Yeast
      1. 3.8.1. Global YeastNon-Alcoholic Wine and BeerMarket,2016-2026 (USD Billion)
      2. 3.8.2. Global YeastNon-Alcoholic Wine and Beer Market, 2016-2026 (Million Liters)
    9. 3.9. Enzymes
      1. 3.9.1. Global EnzymesNon-Alcoholic Wine and BeerMarket,2016-2026 (USD Billion)
      2. 3.9.2. Global EnzymesNon-Alcoholic Wine and Beer Market, 2016-2026 (Million Liters)
  4. CHAPTER 4. Non-Alcoholic Wine and Beer market – Type Analysis
    1. 4.1. Global Non-Alcoholic Wine and Beer Market–TypeOverview
    2. 4.2. Global Non-Alcoholic Wine and BeerMarketShare, by Type, 2018 & 2025 (USD Billion)
    3. 4.3. Global Non-Alcoholic Wine and Beer Market share, by Type, 2018 & 2025 (Million Liters)
    4. 4.4. Alcohol Free
      1. 4.4.1. Global Alcohol FreeNon-Alcoholic Wine and BeerMarket,2016-2026 (USD Billion)
      2. 4.4.2. Global Alcohol FreeNon-Alcoholic Wine and Beer Market, 2016-2026 (Million Liters)
    5. 4.5. Lower Alcohol
      1. 4.5.1. Global Lower AlcoholNon-Alcoholic Wine and BeerMarket,2016-2026 (USD Billion)
      2. 4.5.2. Global Lower AlcoholNon-Alcoholic Wine and Beer Market, 2016-2026 (Million Liters)
  5. CHAPTER 5. Non-Alcoholic Wine and Beer market – Technology Analysis
    1. 5.1. Global Non-Alcoholic Wine and Beer Market–TechnologyOverview
    2. 5.2. Global Non-Alcoholic Wine and BeerMarketShare, by Technology, 2018 & 2025 (USD Billion)
    3. 5.3. Global Non-Alcoholic Wine and Beer Market share, by Technology, 2018 & 2025 (Million Liters)
    4. 5.4. Restricted Fermentation
      1. 5.4.1. Global Restricted FermentationNon-Alcoholic Wine and BeerMarket,2016-2026 (USD Billion)
      2. 5.4.2. Global Restricted FermentationNon-Alcoholic Wine and Beer Market, 2016-2026 (Million Liters)
    5. 5.5. Dealcoholization
      1. 5.5.1. Global DealcoholizationNon-Alcoholic Wine and BeerMarket,2016-2026 (USD Billion)
      2. 5.5.2. Global DealcoholizationNon-Alcoholic Wine and Beer Market, 2016-2026 (Million Liters)
  6. CHAPTER 6. Non-Alcoholic Wine and Beer market – Sales Stores Analysis
    1. 6.1. Global Non-Alcoholic Wine and Beer Market–Sales StoresOverview
    2. 6.2. Global Non-Alcoholic Wine and BeerMarketShare, by Sales Stores, 2018 & 2025 (USD Billion)
    3. 6.3. Global Non-Alcoholic Wine and Beer Market share, by Sales Stores, 2018 & 2025 (Million Liters)
    4. 6.4. Liquor Stores
      1. 6.4.1. Global Liquor StoresNon-Alcoholic Wine and BeerMarket,2016-2026 (USD Billion)
      2. 6.4.2. Global Liquor StoresNon-Alcoholic Wine and Beer Market, 2016-2026 (Million Liters)
    5. 6.5. Convenience Stores
      1. 6.5.1. Global Convenience StoresNon-Alcoholic Wine and BeerMarket,2016-2026 (USD Billion)
      2. 6.5.2. Global Convenience StoresNon-Alcoholic Wine and Beer Market, 2016-2026 (Million Liters)
    6. 6.6. Supermarkets
      1. 6.6.1. Global SupermarketsNon-Alcoholic Wine and BeerMarket,2016-2026 (USD Billion)
      2. 6.6.2. Global SupermarketsNon-Alcoholic Wine and Beer Market, 2016-2026 (Million Liters)
    7. 6.7. Online Stores
      1. 6.7.1. Global Online StoresNon-Alcoholic Wine and BeerMarket,2016-2026 (USD Billion)
      2. 6.7.2. Global Online StoresNon-Alcoholic Wine and Beer Market, 2016-2026 (Million Liters)
    8. 6.8. Restaurants & Bar
      1. 6.8.1. Global Restaurants & BarNon-Alcoholic Wine and BeerMarket,2016-2026 (USD Billion)
      2. 6.8.2. Global Restaurants & BarNon-Alcoholic Wine and Beer Market, 2016-2026 (Million Liters)
  7. CHAPTER 7. Non-Alcoholic Wine and Beer market – Regional Analysis
    1. 7.1. Global Non-Alcoholic Wine and Beer MarketRegionalOverview
    2. 7.2. Global Non-Alcoholic Wine and BeerMarketShare, by Region, 2018 & 2025 (Value)
    3. 7.3. Global Non-Alcoholic Wine and Beer Market Share, by Region, 2018 & 2025 (Volume)
    4. 7.4. North America
      1. 7.4.1. North AmericaNon-Alcoholic Wine and Beer Market size and forecast, 2016-2026
      2. 7.4.2. North AmericaNon-Alcoholic Wine and Beer Market, by Country, 2018 - 2025 (USD Billion)
      3. 7.4.3. North America Market size and forecast, 2016-2026 (Million Liters)
      4. 7.4.4. North AmericaNon-Alcoholic Wine and Beer Market, by Country, 2018 - 2025 (Million Liters)
      5. 7.4.5. North AmericaNon-Alcoholic Wine and Beer Market, by Product, 2016-2026
        1. 7.4.5.1. North AmericaNon-Alcoholic Wine and Beer Market, by Product, 2016-2026 (USD Billion)
        2. 7.4.5.2. North AmericaNon-Alcoholic Wine and Beer Market, by Product, 2016-2026 (Million Liters)
      6. 7.4.6. North AmericaNon-Alcoholic Wine and Beer Market, by Material, 2016-2026
        1. 7.4.6.1. North AmericaNon-Alcoholic Wine and Beer Market, by Material, 2016-2026 (USD Billion)
        2. 7.4.6.2. North AmericaNon-Alcoholic Wine and Beer Market, by Material, 2016-2026 (Million Liters)
      7. 7.4.7. North AmericaNon-Alcoholic Wine and Beer Market, by Type, 2016-2026
        1. 7.4.7.1. North AmericaNon-Alcoholic Wine and Beer Market, by Type, 2016-2026 (USD Billion)
        2. 7.4.7.2. North AmericaNon-Alcoholic Wine and Beer Market, by Type, 2016-2026 (Million Liters)
      8. 7.4.8. North AmericaNon-Alcoholic Wine and Beer Market, by Technology, 2016-2026
        1. 7.4.8.1. North AmericaNon-Alcoholic Wine and Beer Market, by Technology, 2016-2026 (USD Billion)
        2. 7.4.8.2. North AmericaNon-Alcoholic Wine and Beer Market, by Technology, 2016-2026 (Million Liters)
      9. 7.4.9. North AmericaNon-Alcoholic Wine and Beer Market, by Sales Stores, 2016-2026
        1. 7.4.9.1. North AmericaNon-Alcoholic Wine and Beer Market, by Sales Stores, 2016-2026 (USD Billion)
        2. 7.4.9.2. North AmericaNon-Alcoholic Wine and Beer Market, by Sales Stores, 2016-2026 (Million Liters)
      10. 7.4.10. U.S.
        1. 7.4.10.1. U.S. Market size and forecast, 2016-2026 (USD Billion)
        2. 7.4.10.2. U.S. Market size and forecast, 2016-2026 (Million Liters)
      11. 7.4.11. Canada
        1. 7.4.11.1. Canada Market size and forecast, 2016-2026 (USD Billion)
        2. 7.4.11.2. Canada Market size and forecast, 2016-2026 (Million Liters)
    5. 7.5. Europe
      1. 7.5.1. EuropeNon-Alcoholic Wine and Beer Market size and forecast, 2016-2026
      2. 7.5.2. EuropeNon-Alcoholic Wine and Beer Market, by Country, 2018 - 2025 (USD Billion)
      3. 7.5.3. Europe Market size and forecast, 2016-2026 (Million Liters)
      4. 7.5.4. EuropeNon-Alcoholic Wine and Beer Market, by Country, 2018 - 2025 (Million Liters)
      5. 7.5.5. EuropeNon-Alcoholic Wine and Beer Market, by Product, 2016-2026
        1. 7.5.5.1. EuropeNon-Alcoholic Wine and Beer Market, by Product, 2016-2026 (USD Billion)
        2. 7.5.5.2. EuropeNon-Alcoholic Wine and Beer Market, by Product, 2016-2026 (Million Liters)
      6. 7.5.6. EuropeNon-Alcoholic Wine and Beer Market, by Material, 2016-2026
        1. 7.5.6.1. EuropeNon-Alcoholic Wine and Beer Market, by Material, 2016-2026 (USD Billion)
        2. 7.5.6.2. EuropeNon-Alcoholic Wine and Beer Market, by Material, 2016-2026 (Million Liters)
      7. 7.5.7. EuropeNon-Alcoholic Wine and Beer Market, by Type, 2016-2026
        1. 7.5.7.1. EuropeNon-Alcoholic Wine and Beer Market, by Type, 2016-2026 (USD Billion)
        2. 7.5.7.2. EuropeNon-Alcoholic Wine and Beer Market, by Type, 2016-2026 (Million Liters)
      8. 7.5.8. EuropeNon-Alcoholic Wine and Beer Market, by Technology, 2016-2026
        1. 7.5.8.1. EuropeNon-Alcoholic Wine and Beer Market, by Technology, 2016-2026 (USD Billion)
        2. 7.5.8.2. EuropeNon-Alcoholic Wine and Beer Market, by Technology, 2016-2026 (Million Liters)
      9. 7.5.9. EuropeNon-Alcoholic Wine and Beer Market, by Sales Stores, 2016-2026
        1. 7.5.9.1. EuropeNon-Alcoholic Wine and Beer Market, by Sales Stores, 2016-2026 (USD Billion)
        2. 7.5.9.2. EuropeNon-Alcoholic Wine and Beer Market, by Sales Stores, 2016-2026 (Million Liters)
      10. 7.5.10. Germany
        1. 7.5.10.1. Germany Market size and forecast, 2016-2026 (USD Billion)
        2. 7.5.10.2. Germany Market size and forecast, 2016-2026 (Million Liters)
      11. 7.5.11. France
        1. 7.5.11.1. France Market size and forecast, 2016-2026 (USD Billion)
        2. 7.5.11.2. France Market size and forecast, 2016-2026 (Million Liters)
      12. 7.5.12. U.K.
        1. 7.5.12.1. U.K. Market size and forecast, 2016-2026 (USD Billion)
        2. 7.5.12.2. U.K. Market size and forecast, 2016-2026 (Million Liters)
      13. 7.5.13. Italy
        1. 7.5.13.1. Italy Market size and forecast, 2016-2026 (USD Billion)
        2. 7.5.13.2. Italy Market size and forecast, 2016-2026 (Million Liters)
      14. 7.5.14. Spain
        1. 7.5.14.1. Spain Market size and forecast, 2016-2026 (USD Billion)
        2. 7.5.14.2. Spain Market size and forecast, 2016-2026 (Million Liters)
      15. 7.5.15. Rest of Europe
        1. 7.5.15.1. Rest of Europe Market size and forecast, 2016-2026 (USD Billion)
        2. 7.5.15.2. Rest of Europe Market size and forecast, 2016-2026 (Million Liters)
    6. 7.6. Asia Pacific
      1. 7.6.1. Asia PacificNon-Alcoholic Wine and Beer Market size and forecast, 2016-2026
      2. 7.6.2. Asia PacificNon-Alcoholic Wine and Beer Market, by Country, 2018 - 2025 (USD Billion)
      3. 7.6.3. Asia Pacific Market size and forecast, 2016-2026 (Million Liters)
      4. 7.6.4. Asia PacificNon-Alcoholic Wine and Beer Market, by Country, 2018 - 2025 (Million Liters)
      5. 7.6.5. Asia PacificNon-Alcoholic Wine and Beer Market, by Product, 2016-2026
        1. 7.6.5.1. Asia PacificNon-Alcoholic Wine and Beer Market, by Product, 2016-2026 (USD Billion)
        2. 7.6.5.2. Asia PacificNon-Alcoholic Wine and Beer Market, by Product, 2016-2026 (Million Liters)
      6. 7.6.6. Asia PacificNon-Alcoholic Wine and Beer Market, by Material, 2016-2026
        1. 7.6.6.1. Asia PacificNon-Alcoholic Wine and Beer Market, by Material, 2016-2026 (USD Billion)
        2. 7.6.6.2. Asia PacificNon-Alcoholic Wine and Beer Market, by Material, 2016-2026 (Million Liters)
      7. 7.6.7. Asia PacificNon-Alcoholic Wine and Beer Market, by Type, 2016-2026
        1. 7.6.7.1. Asia PacificNon-Alcoholic Wine and Beer Market, by Type, 2016-2026 (USD Billion)
        2. 7.6.7.2. Asia PacificNon-Alcoholic Wine and Beer Market, by Type, 2016-2026 (Million Liters)
      8. 7.6.8. Asia PacificNon-Alcoholic Wine and Beer Market, by Technology, 2016-2026
        1. 7.6.8.1. Asia PacificNon-Alcoholic Wine and Beer Market, by Technology, 2016-2026 (USD Billion)
        2. 7.6.8.2. Asia PacificNon-Alcoholic Wine and Beer Market, by Technology, 2016-2026 (Million Liters)
      9. 7.6.9. Asia PacificNon-Alcoholic Wine and Beer Market, by Sales Stores, 2016-2026
        1. 7.6.9.1. Asia PacificNon-Alcoholic Wine and Beer Market, by Sales Stores, 2016-2026 (USD Billion)
        2. 7.6.9.2. Asia PacificNon-Alcoholic Wine and Beer Market, by Sales Stores, 2016-2026 (Million Liters)
      10. 7.6.10. China
        1. 7.6.10.1. China Market size and forecast, 2016-2026 (USD Billion)
        2. 7.6.10.2. China Market size and forecast, 2016-2026 (Million Liters)
      11. 7.6.11. Japan
        1. 7.6.11.1. Japan Market size and forecast, 2016-2026 (USD Billion)
        2. 7.6.11.2. Japan Market size and forecast, 2016-2026 (Million Liters)
      12. 7.6.12. India
        1. 7.6.12.1. India Market size and forecast, 2016-2026 (USD Billion)
        2. 7.6.12.2. India Market size and forecast, 2016-2026 (Million Liters)
      13. 7.6.13. South Korea
        1. 7.6.13.1. South Korea Market size and forecast, 2016-2026 (USD Billion)
        2. 7.6.13.2. South Korea Market size and forecast, 2016-2026 (Million Liters)
      14. 7.6.14. South-East Asia
        1. 7.6.14.1. South-East Asia Market size and forecast, 2016-2026 (USD Billion)
        2. 7.6.14.2. South-East Asia Market size and forecast, 2016-2026 (Million Liters)
      15. 7.6.15. Rest of Asia Pacific
        1. 7.6.15.1. Rest of Asia Pacific Market size and forecast, 2016-2026 (USD Billion)
        2. 7.6.15.2. Rest of Asia Pacific Market size and forecast, 2016-2026 (Million Liters)
    7. 7.7. Latin America
      1. 7.7.1. Latin AmericaNon-Alcoholic Wine and Beer Market size and forecast, 2016-2026
      2. 7.7.2. Latin AmericaNon-Alcoholic Wine and Beer Market, by Country, 2018 - 2025 (USD Billion)
      3. 7.7.3. Latin America Market size and forecast, 2016-2026 (Million Liters)
      4. 7.7.4. Latin AmericaNon-Alcoholic Wine and Beer Market, by Country, 2018 - 2025 (Million Liters)
      5. 7.7.5. Latin AmericaNon-Alcoholic Wine and Beer Market, by Product, 2016-2026
        1. 7.7.5.1. Latin AmericaNon-Alcoholic Wine and Beer Market, by Product, 2016-2026 (USD Billion)
        2. 7.7.5.2. Latin AmericaNon-Alcoholic Wine and Beer Market, by Product, 2016-2026 (Million Liters)
      6. 7.7.6. Latin AmericaNon-Alcoholic Wine and Beer Market, by Material, 2016-2026
        1. 7.7.6.1. Latin AmericaNon-Alcoholic Wine and Beer Market, by Material, 2016-2026 (USD Billion)
        2. 7.7.6.2. Latin AmericaNon-Alcoholic Wine and Beer Market, by Material, 2016-2026 (Million Liters)
      7. 7.7.7. Latin AmericaNon-Alcoholic Wine and Beer Market, by Type, 2016-2026
        1. 7.7.7.1. Latin AmericaNon-Alcoholic Wine and Beer Market, by Type, 2016-2026 (USD Billion)
        2. 7.7.7.2. Latin AmericaNon-Alcoholic Wine and Beer Market, by Type, 2016-2026 (Million Liters)
      8. 7.7.8. Latin AmericaNon-Alcoholic Wine and Beer Market, by Technology, 2016-2026
        1. 7.7.8.1. Latin AmericaNon-Alcoholic Wine and Beer Market, by Technology, 2016-2026 (USD Billion)
        2. 7.7.8.2. Latin AmericaNon-Alcoholic Wine and Beer Market, by Technology, 2016-2026 (Million Liters)
      9. 7.7.9. Latin AmericaNon-Alcoholic Wine and Beer Market, by Sales Stores, 2016-2026
        1. 7.7.9.1. Latin AmericaNon-Alcoholic Wine and Beer Market, by Sales Stores, 2016-2026 (USD Billion)
        2. 7.7.9.2. Latin AmericaNon-Alcoholic Wine and Beer Market, by Sales Stores, 2016-2026 (Million Liters)
      10. 7.7.10. Brazil
        1. 7.7.10.1. Brazil Market size and forecast, 2016-2026 (USD Billion)
        2. 7.7.10.2. Brazil Market size and forecast, 2016-2026 (Million Liters)
      11. 7.7.11. Mexico
        1. 7.7.11.1. Mexico Market size and forecast, 2016-2026 (USD Billion)
        2. 7.7.11.2. Mexico Market size and forecast, 2016-2026 (Million Liters)
      12. 7.7.12. Rest of Latin America
        1. 7.7.12.1. Rest of Latin America Market size and forecast, 2016-2026 (USD Billion)
        2. 7.7.12.2. Rest of Latin America Market size and forecast, 2016-2026 (Million Liters)
    8. 7.8. The Middle-East and Africa
      1. 7.8.1. The Middle-East and AfricaNon-Alcoholic Wine and Beer Market size and forecast, 2016-2026
      2. 7.8.2. The Middle-East and AfricaNon-Alcoholic Wine and Beer Market, by Country, 2018 - 2025 (USD Billion)
      3. 7.8.3. The Middle-East and Africa Market size and forecast, 2016-2026 (Million Liters)
      4. 7.8.4. The Middle-East and AfricaNon-Alcoholic Wine and Beer Market, by Country, 2018 - 2025 (Million Liters)
      5. 7.8.5. The Middle-East and AfricaNon-Alcoholic Wine and Beer Market, by Product, 2016-2026
        1. 7.8.5.1. The Middle-East and AfricaNon-Alcoholic Wine and Beer Market, by Product, 2016-2026 (USD Billion)
        2. 7.8.5.2. The Middle-East and AfricaNon-Alcoholic Wine and Beer Market, by Product, 2016-2026 (Million Liters)
      6. 7.8.6. The Middle-East and AfricaNon-Alcoholic Wine and Beer Market, by Material, 2016-2026
        1. 7.8.6.1. The Middle-East and AfricaNon-Alcoholic Wine and Beer Market, by Material, 2016-2026 (USD Billion)
        2. 7.8.6.2. The Middle-East and AfricaNon-Alcoholic Wine and Beer Market, by Material, 2016-2026 (Million Liters)
      7. 7.8.7. The Middle-East and AfricaNon-Alcoholic Wine and Beer Market, by Type, 2016-2026
        1. 7.8.7.1. The Middle-East and AfricaNon-Alcoholic Wine and Beer Market, by Type, 2016-2026 (USD Billion)
        2. 7.8.7.2. The Middle-East and AfricaNon-Alcoholic Wine and Beer Market, by Type, 2016-2026 (Million Liters)
      8. 7.8.8. The Middle-East and AfricaNon-Alcoholic Wine and Beer Market, by Technology, 2016-2026
        1. 7.8.8.1. The Middle-East and AfricaNon-Alcoholic Wine and Beer Market, by Technology, 2016-2026 (USD Billion)
        2. 7.8.8.2. The Middle-East and AfricaNon-Alcoholic Wine and Beer Market, by Technology, 2016-2026 (Million Liters)
      9. 7.8.9. The Middle-East and AfricaNon-Alcoholic Wine and Beer Market, by Sales Stores, 2016-2026
        1. 7.8.9.1. The Middle-East and AfricaNon-Alcoholic Wine and Beer Market, by Sales Stores, 2016-2026 (USD Billion)
        2. 7.8.9.2. The Middle-East and AfricaNon-Alcoholic Wine and Beer Market, by Sales Stores, 2016-2026 (Million Liters)
      10. 7.8.10. GCC Countries
        1. 7.8.10.1. GCC Countries Market size and forecast, 2016-2026 (USD Billion)
        2. 7.8.10.2. GCC Countries Market size and forecast, 2016-2026 (Million Liters)
      11. 7.8.11. South Africa
        1. 7.8.11.1. South Africa Market size and forecast, 2016-2026 (USD Billion)
        2. 7.8.11.2. South Africa Market size and forecast, 2016-2026 (Million Liters)
      12. 7.8.12. Rest of Middle-East Africa
        1. 7.8.12.1. Rest of Middle-East Africa Market size and forecast, 2016-2026 (USD Billion)
        2. 7.8.12.2. Rest of Middle-East Africa Market size and forecast, 2016-2026 (Million Liters)
  8. CHAPTER 8. Non-Alcoholic Wine and BeerProduction, Consumption, Export, Import by Regions
    1. 8.1. Global Non-Alcoholic Wine and Beer production and revenue, 2015-2025 (USD Billion) (Million Liters)
    2. 8.2. Global Import and Export Analysis, by Region
  9. CHAPTER 9. Non-Alcoholic Wine and Beer market – Competitive Landscape
    1. 9.1. Competitor Market Share – Revenue
    2. 9.2. Market Concentration Rate Analysis, Top 3 and Top 5 Players
    3. 9.3. Competitor Market Share – Volume
    4. 9.4. Strategic Development
      1. 9.4.1. Acquisitions and Mergers
      2. 9.4.2. New Products
      3. 9.4.3. Research & Development Activities
  10. CHAPTER 10. Company Profiles
    1. 10.1. Erdinger
      1. 10.1.1. Company Overview
      2. 10.1.2. Erdinger Sales, Revenue, Price, and Gross Margin
      3. 10.1.3. Product portfolio
      4. 10.1.4. Recent initiatives
    2. 10.2. Moscow Brewery Company
      1. 10.2.1. Company Overview
      2. 10.2.2. Moscow Brewery Company Sales, Revenue, Price, and Gross Margin
      3. 10.2.3. Product portfolio
      4. 10.2.4. Recent initiatives
    3. 10.3. Carlsberg
      1. 10.3.1. Company Overview
      2. 10.3.2. Carlsberg Sales, Revenue, Price, and Gross Margin
      3. 10.3.3. Product portfolio
      4. 10.3.4. Recent initiatives
    4. 10.4. Arpanoosh
      1. 10.4.1. Company Overview
      2. 10.4.2. Arpanoosh Sales, Revenue, Price, and Gross Margin
      3. 10.4.3. Product portfolio
      4. 10.4.4. Recent initiatives
    5. 10.5. Bayerische Staatsbrauerei Weihenstepha Big Drop Brewing Co. Ltd.
      1. 10.5.1. Company Overview
      2. 10.5.2. Bayerische Staatsbrauerei Weihenstepha Big Drop Brewing Co. Ltd. Sales, Revenue, Price, and Gross Margin
      3. 10.5.3. Product portfolio
      4. 10.5.4. Recent initiatives
    6. 10.6. S. Martinelli & Company
      1. 10.6.1. Company Overview
      2. 10.6.2. S. Martinelli & Company Sales, Revenue, Price, and Gross Margin
      3. 10.6.3. Product portfolio
      4. 10.6.4. Recent initiatives
    7. 10.7. Anheuser-Busch InBev
      1. 10.7.1. Company Overview
      2. 10.7.2. Anheuser-Busch InBev Sales, Revenue, Price, and Gross Margin
      3. 10.7.3. Product portfolio
      4. 10.7.4. Recent initiatives
    8. 10.8. Iran Behnoush Co.
      1. 10.8.1. Company Overview
      2. 10.8.2. Iran Behnoush Co. Sales, Revenue, Price, and Gross Margin
      3. 10.8.3. Product portfolio
      4. 10.8.4. Recent initiatives
    9. 10.9. Burke Distribution Corporation
      1. 10.9.1. Company Overview
      2. 10.9.2. Burke Distribution Corporation Sales, Revenue, Price, and Gross Margin
      3. 10.9.3. Product portfolio
      4. 10.9.4. Recent initiatives
    10. 10.10. J. Lohr Vineyards & Wines
      1. 10.10.1. Company Overview
      2. 10.10.2. J. Lohr Vineyards & Wines Sales, Revenue, Price, and Gross Margin
      3. 10.10.3. Product portfolio
      4. 10.10.4. Recent initiatives
    11. 10.11. Kirin Holdings Company
      1. 10.11.1. Company Overview
      2. 10.11.2. Kirin Holdings Company Sales, Revenue, Price, and Gross Margin
      3. 10.11.3. Product portfolio
      4. 10.11.4. Recent initiatives
    12. 10.12. Heineken N.V
      1. 10.12.1. Company Overview
      2. 10.12.2. Heineken N.V Sales, Revenue, Price, and Gross Margin
      3. 10.12.3. Product portfolio
      4. 10.12.4. Recent initiatives
    13. 10.13. Sutter Home Winery Inc.
      1. 10.13.1. Company Overview
      2. 10.13.2. Sutter Home Winery Inc. Sales, Revenue, Price, and Gross Margin
      3. 10.13.3. Product portfolio
      4. 10.13.4. Recent initiatives
    14. 10.14. Coors Brewing Company
      1. 10.14.1. Company Overview
      2. 10.14.2. Coors Brewing Company Sales, Revenue, Price, and Gross Margin
      3. 10.14.3. Product portfolio
      4. 10.14.4. Recent initiatives
    15. 10.15. Halewood Wines & Spirits
      1. 10.15.1. Company Overview
      2. 10.15.2. Halewood Wines & Spirits Sales, Revenue, Price, and Gross Margin
      3. 10.15.3. Product portfolio
      4. 10.15.4. Recent initiatives
    16. 10.16. Bernard Brewery
      1. 10.16.1. Company Overview
      2. 10.16.2. Bernard Brewery Sales, Revenue, Price, and Gross Margin
      3. 10.16.3. Product portfolio
      4. 10.16.4. Recent initiatives
    17. 10.17. Pierre Chavin
      1. 10.17.1. Company Overview
      2. 10.17.2. Pierre Chavin Sales, Revenue, Price, and Gross Margin
      3. 10.17.3. Product portfolio
      4. 10.17.4. Recent initiatives
    18. 10.18. Suntory Brewery Co. Ltd.
      1. 10.18.1. Company Overview
      2. 10.18.2. Suntory Brewery Co. Ltd. Sales, Revenue, Price, and Gross Margin
      3. 10.18.3. Product portfolio
      4. 10.18.4. Recent initiatives
    19. 10.19. Krombacher Brauerei
      1. 10.19.1. Company Overview
      2. 10.19.2. Krombacher Brauerei Sales, Revenue, Price, and Gross Margin
      3. 10.19.3. Product portfolio
      4. 10.19.4. Recent initiatives
  11. CHAPTER 11. Non-Alcoholic Wine and Beer — Industry Analysis
    1. 11.1. Introduction and Taxonomy
    2. 11.2. Non-Alcoholic Wine and Beer Market – Key Trends
      1. 11.2.1. Market Drivers
      2. 11.2.2. Market Restraints
      3. 11.2.3. Market Opportunities
    3. 11.3. Value Chain Analysis
    4. 11.4. Key Mandates and Regulations
    5. 11.5. Technology Roadmap and Timeline
    6. 11.6. Non-Alcoholic Wine and Beer market – Attractiveness Analysis
      1. 11.6.1. By Product
      2. 11.6.2. By Material
      3. 11.6.3. By Type
      4. 11.6.4. By Technology
      5. 11.6.5. By Sales Stores
      6. 11.6.6. By Region
  12. CHAPTER 12. Raw Material analysis
    1. 12.1. Non-Alcoholic Wine and Beer Key Raw Material Analysis
      1. 12.1.1. Key Raw Materials
      2. 12.1.2. Price Trend of Key Raw Materials
    2. 12.2. Key Suppliers of Raw Materials
    3. 12.3. Proportion of Manufacturing Cost Structure
      1. 12.3.1. Raw Materials
      2. 12.3.2. Labor Cost
    4. 12.4. Manufacturing Expenses Analysis of Non-Alcoholic Wine and Beer
  13. CHAPTER 13. Industrial Chain, Sourcing Strategy and Downstream Buyers
    1. 13.1. Non-Alcoholic Wine and Beer Industrial Chain Analysis
    2. 13.2. Upstream Raw Materials Sourcing
      1. 13.2.1. Risk Mitigation:
      2. 13.2.2. Supplier Relationships:
      3. 13.2.3. Business Processes:
      4. 13.2.4. Securing the Product:
    3. 13.3. Raw Materials Sources of Non-Alcoholic Wine and Beer Major Manufacturers in 2016
    4. 13.4. Downstream Buyers
    5. 13.5. Distributors/Traders List
  14. CHAPTER 14. Marketing Strategy Analysis, Distributors
    1. 14.1. Marketing Channel
    2. 14.2. Direct Marketing
    3. 14.3. Indirect Marketing
    4. 14.4. Marketing Channel Development Trend
    5. 14.5. Economic/Political Environmental Change
  15. CHAPTER 15. Report Conclusion
  16. CHAPTER 16. Research Approach & Methodology
    1. 16.1. Report Description
    2. 16.2. Research Scope
    3. 16.3. Research Methodology
      1. 16.3.1. Secondary Research
      2. 16.3.2. Primary Research
      3. 16.3.3. Models
        1. 16.3.3.1. Company Share Analysis Model
        2. 16.3.3.2. Revenue Based Modeling
        3. 16.3.3.3. Research Limitations

        List of Figures

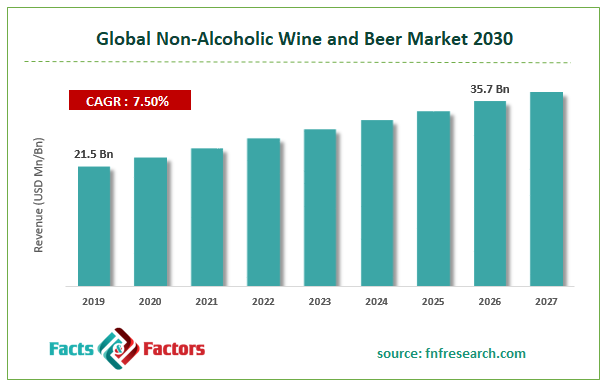
        FIG. 1 Global Non-Alcoholic Wine and Beer Market, 2016-2026(USD Billion)
        FIG. 2 Global Non-Alcoholic Wine and Beer MarketShare, by Product, 2018 & 2025 (USD Billion)
        FIG. 3 Global Non-Alcoholic Wine and Beer Market share, by Product, 2018 & 2025 (Million Liters)
        FIG. 4 Global BeerNon-Alcoholic Wine and BeerMarket,2016-2026 (USD Billion)
        FIG. 5 Global BeerNon-Alcoholic Wine and Beer  Market, 2016-2026 (Million Liters)
        FIG. 6 Global WineNon-Alcoholic Wine and BeerMarket,2016-2026 (USD Billion)
        FIG. 7 Global WineNon-Alcoholic Wine and Beer  Market, 2016-2026 (Million Liters)
        FIG. 8 Global Non-Alcoholic Wine and Beer MarketShare, by Material, 2018 & 2025 (USD Billion)
        FIG. 9 Global Non-Alcoholic Wine and Beer Market share, by Material, 2018 & 2025 (Million Liters)
        FIG. 10 Global GrapesNon-Alcoholic Wine and BeerMarket,2016-2026 (USD Billion)
        FIG. 11 Global GrapesNon-Alcoholic Wine and Beer  Market, 2016-2026 (Million Liters)
        FIG. 12 Global Berries/ ApplesNon-Alcoholic Wine and BeerMarket,2016-2026 (USD Billion)
        FIG. 13 Global Berries/ ApplesNon-Alcoholic Wine and Beer  Market, 2016-2026 (Million Liters)
        FIG. 14 Global Malted GrainsNon-Alcoholic Wine and BeerMarket,2016-2026 (USD Billion)
        FIG. 15 Global Malted GrainsNon-Alcoholic Wine and Beer  Market, 2016-2026 (Million Liters)
        FIG. 16 Global HopsNon-Alcoholic Wine and BeerMarket,2016-2026 (USD Billion)
        FIG. 17 Global HopsNon-Alcoholic Wine and Beer  Market, 2016-2026 (Million Liters)
        FIG. 18 Global YeastNon-Alcoholic Wine and BeerMarket,2016-2026 (USD Billion)
        FIG. 19 Global YeastNon-Alcoholic Wine and Beer  Market, 2016-2026 (Million Liters)
        FIG. 20 Global EnzymesNon-Alcoholic Wine and BeerMarket,2016-2026 (USD Billion)
        FIG. 21 Global EnzymesNon-Alcoholic Wine and Beer  Market, 2016-2026 (Million Liters)
        FIG. 22 Global Non-Alcoholic Wine and Beer MarketShare, by Type, 2018 & 2025 (USD Billion)
        FIG. 23 Global Non-Alcoholic Wine and Beer Market share, by Type, 2018 & 2025 (Million Liters)
        FIG. 24 Global Alcohol FreeNon-Alcoholic Wine and BeerMarket,2016-2026 (USD Billion)
        FIG. 25 Global Alcohol FreeNon-Alcoholic Wine and Beer  Market, 2016-2026 (Million Liters)
        FIG. 26 Global Lower AlcoholNon-Alcoholic Wine and BeerMarket,2016-2026 (USD Billion)
        FIG. 27 Global Lower AlcoholNon-Alcoholic Wine and Beer  Market, 2016-2026 (Million Liters)
        FIG. 28 Global Non-Alcoholic Wine and Beer MarketShare, by Technology, 2018 & 2025 (USD Billion)
        FIG. 29 Global Non-Alcoholic Wine and Beer Market share, by Technology, 2018 & 2025 (Million Liters)
        FIG. 30 Global Restricted FermentationNon-Alcoholic Wine and BeerMarket,2016-2026 (USD Billion)
        FIG. 31 Global Restricted FermentationNon-Alcoholic Wine and Beer  Market, 2016-2026 (Million Liters)
        FIG. 32 Global DealcoholizationNon-Alcoholic Wine and BeerMarket,2016-2026 (USD Billion)
        FIG. 33 Global DealcoholizationNon-Alcoholic Wine and Beer  Market, 2016-2026 (Million Liters)
        FIG. 34 Global Non-Alcoholic Wine and Beer MarketShare, by Sales Stores, 2018 & 2025 (USD Billion)
        FIG. 35 Global Non-Alcoholic Wine and Beer Market share, by Sales Stores, 2018 & 2025 (Million Liters)
        FIG. 36 Global Liquor StoresNon-Alcoholic Wine and BeerMarket,2016-2026 (USD Billion)
        FIG. 37 Global Liquor StoresNon-Alcoholic Wine and Beer  Market, 2016-2026 (Million Liters)
        FIG. 38 Global Convenience StoresNon-Alcoholic Wine and BeerMarket,2016-2026 (USD Billion)
        FIG. 39 Global Convenience StoresNon-Alcoholic Wine and Beer  Market, 2016-2026 (Million Liters)
        FIG. 40 Global SupermarketsNon-Alcoholic Wine and BeerMarket,2016-2026 (USD Billion)
        FIG. 41 Global SupermarketsNon-Alcoholic Wine and Beer  Market, 2016-2026 (Million Liters)
        FIG. 42 Global Online StoresNon-Alcoholic Wine and BeerMarket,2016-2026 (USD Billion)
        FIG. 43 Global Online StoresNon-Alcoholic Wine and Beer  Market, 2016-2026 (Million Liters)
        FIG. 44 Global Restaurants & BarNon-Alcoholic Wine and BeerMarket,2016-2026 (USD Billion)
        FIG. 45 Global Restaurants & BarNon-Alcoholic Wine and Beer  Market, 2016-2026 (Million Liters)
        FIG. 46 Global Non-Alcoholic Wine and Beer MarketShare, by Region, 2018 & 2025
        FIG. 47 Global Non-Alcoholic Wine and Beer MarketShare, by Region, 2018 & 2025
        FIG. 48 North AmericaNon-Alcoholic Wine and Beer Market, 2016-2026
        FIG. 49 North AmericaNon-Alcoholic Wine and Beer  Market, 2016-2026 (Million Liters)
        FIG. 50 U.S.Non-Alcoholic Wine and Beer Market, 2016-2026
        FIG. 51 U.S.Non-Alcoholic Wine and Beer  Market, 2016-2026 (Million Liters)
        FIG. 52 CanadaNon-Alcoholic Wine and Beer Market, 2016-2026
        FIG. 53 CanadaNon-Alcoholic Wine and Beer  Market, 2016-2026 (Million Liters)
        FIG. 54 EuropeNon-Alcoholic Wine and Beer Market, 2016-2026
        FIG. 55 EuropeNon-Alcoholic Wine and Beer  Market, 2016-2026 (Million Liters)
        FIG. 56 GermanyNon-Alcoholic Wine and Beer Market, 2016-2026
        FIG. 57 GermanyNon-Alcoholic Wine and Beer  Market, 2016-2026 (Million Liters)
        FIG. 58 FranceNon-Alcoholic Wine and Beer Market, 2016-2026
        FIG. 59 FranceNon-Alcoholic Wine and Beer  Market, 2016-2026 (Million Liters)
        FIG. 60 U.K.Non-Alcoholic Wine and Beer Market, 2016-2026
        FIG. 61 U.K.Non-Alcoholic Wine and Beer  Market, 2016-2026 (Million Liters)
        FIG. 62 ItalyNon-Alcoholic Wine and Beer Market, 2016-2026
        FIG. 63 ItalyNon-Alcoholic Wine and Beer  Market, 2016-2026 (Million Liters)
        FIG. 64 SpainNon-Alcoholic Wine and Beer Market, 2016-2026
        FIG. 65 SpainNon-Alcoholic Wine and Beer  Market, 2016-2026 (Million Liters)
        FIG. 66 Rest of EuropeNon-Alcoholic Wine and Beer Market, 2016-2026
        FIG. 67 Rest of EuropeNon-Alcoholic Wine and Beer  Market, 2016-2026 (Million Liters)
        FIG. 68 Asia PacificNon-Alcoholic Wine and Beer Market, 2016-2026
        FIG. 69 Asia PacificNon-Alcoholic Wine and Beer  Market, 2016-2026 (Million Liters)
        FIG. 70 ChinaNon-Alcoholic Wine and Beer Market, 2016-2026
        FIG. 71 ChinaNon-Alcoholic Wine and Beer  Market, 2016-2026 (Million Liters)
        FIG. 72 JapanNon-Alcoholic Wine and Beer Market, 2016-2026
        FIG. 73 JapanNon-Alcoholic Wine and Beer  Market, 2016-2026 (Million Liters)
        FIG. 74 IndiaNon-Alcoholic Wine and Beer Market, 2016-2026
        FIG. 75 IndiaNon-Alcoholic Wine and Beer  Market, 2016-2026 (Million Liters)
        FIG. 76 South  KoreaNon-Alcoholic Wine and Beer Market, 2016-2026
        FIG. 77 South  KoreaNon-Alcoholic Wine and Beer  Market, 2016-2026 (Million Liters)
        FIG. 78 South-East AsiaNon-Alcoholic Wine and Beer Market, 2016-2026
        FIG. 79 South-East AsiaNon-Alcoholic Wine and Beer  Market, 2016-2026 (Million Liters)
        FIG. 80 Rest of Asia PacificNon-Alcoholic Wine and Beer Market, 2016-2026
        FIG. 81 Rest of Asia PacificNon-Alcoholic Wine and Beer  Market, 2016-2026 (Million Liters)
        FIG. 82 Latin AmericaNon-Alcoholic Wine and Beer Market, 2016-2026
        FIG. 83 Latin AmericaNon-Alcoholic Wine and Beer  Market, 2016-2026 (Million Liters)
        FIG. 84 BrazilNon-Alcoholic Wine and Beer Market, 2016-2026
        FIG. 85 BrazilNon-Alcoholic Wine and Beer  Market, 2016-2026 (Million Liters)
        FIG. 86 MexicoNon-Alcoholic Wine and Beer Market, 2016-2026
        FIG. 87 MexicoNon-Alcoholic Wine and Beer  Market, 2016-2026 (Million Liters)
        FIG. 88 Rest of Latin AmericaNon-Alcoholic Wine and Beer Market, 2016-2026
        FIG. 89 Rest of Latin AmericaNon-Alcoholic Wine and Beer  Market, 2016-2026 (Million Liters)
        FIG. 90 The Middle-East and AfricaNon-Alcoholic Wine and Beer Market, 2016-2026
        FIG. 91 The Middle-East and AfricaNon-Alcoholic Wine and Beer  Market, 2016-2026 (Million Liters)
        FIG. 92 GCC CountriesNon-Alcoholic Wine and Beer Market, 2016-2026
        FIG. 93 GCC CountriesNon-Alcoholic Wine and Beer  Market, 2016-2026 (Million Liters)
        FIG. 94 South AfricaNon-Alcoholic Wine and Beer Market, 2016-2026
        FIG. 95 South AfricaNon-Alcoholic Wine and Beer  Market, 2016-2026 (Million Liters)
        FIG. 96 Rest of Middle-East AfricaNon-Alcoholic Wine and Beer Market, 2016-2026
        FIG. 97 Rest of Middle-East AfricaNon-Alcoholic Wine and Beer  Market, 2016-2026 (Million Liters)
        FIG. 98 Global Non-Alcoholic Wine and Beer production and revenue, 2015-2025 (USD Billion) (Million Liters)
        FIG. 99 North AmericaNon-Alcoholic Wine and Beer production and revenue, 2015-2025 (USD Billion) (Million Liters)
        FIG. 100 EuropeNon-Alcoholic Wine and Beer production and revenue, 2015-2025 (USD Billion) (Million Liters)
        FIG. 101 Asia Pacific Non-Alcoholic Wine and Beer production and revenue, 2015-2025 (USD Billion) (Million Liters)
        FIG. 102 Latin America Non-Alcoholic Wine and Beer production and revenue, 2015-2025 (USD Billion) (Million Liters)
        FIG. 103 Middle East and Africa Non-Alcoholic Wine and Beer production and revenue, 2015-2025 (USD Billion) (Million Liters)
        FIG. 104 Competitor Market Share – Revenue
        FIG. 105 Competitor Market Share – Volume
        FIG. 106 Erdinger Revenue and Growth Rate
        FIG. 107 Erdinger Market Share
        FIG. 108 Moscow Brewery Company Revenue and Growth Rate
        FIG. 109 Moscow Brewery Company Market Share
        FIG. 110 Carlsberg Revenue and Growth Rate
        FIG. 111 Carlsberg Market Share
        FIG. 112 Arpanoosh Revenue and Growth Rate
        FIG. 113 Arpanoosh Market Share
        FIG. 114 Bayerische Staatsbrauerei Weihenstepha Big Drop Brewing Co. Ltd. Revenue and Growth Rate
        FIG. 115 Bayerische Staatsbrauerei Weihenstepha Big Drop Brewing Co. Ltd. Market Share
        FIG. 116 S. Martinelli & Company Revenue and Growth Rate
        FIG. 117 S. Martinelli & Company Market Share
        FIG. 118 Anheuser-Busch InBev Revenue and Growth Rate
        FIG. 119 Anheuser-Busch InBev Market Share
        FIG. 120 Iran Behnoush Co. Revenue and Growth Rate
        FIG. 121 Iran Behnoush Co. Market Share
        FIG. 122 Burke Distribution Corporation Revenue and Growth Rate
        FIG. 123 Burke Distribution Corporation Market Share
        FIG. 124 J. Lohr Vineyards & Wines Revenue and Growth Rate
        FIG. 125 J. Lohr Vineyards & Wines Market Share
        FIG. 126 Kirin Holdings Company Revenue and Growth Rate
        FIG. 127 Kirin Holdings Company Market Share
        FIG. 128 Heineken N.V Revenue and Growth Rate
        FIG. 129 Heineken N.V Market Share
        FIG. 130 Sutter Home Winery Inc. Revenue and Growth Rate
        FIG. 131 Sutter Home Winery Inc. Market Share
        FIG. 132 Coors Brewing Company Revenue and Growth Rate
        FIG. 133 Coors Brewing Company Market Share
        FIG. 134 Halewood Wines & Spirits Revenue and Growth Rate
        FIG. 135 Halewood Wines & Spirits Market Share
        FIG. 136 Bernard Brewery Revenue and Growth Rate
        FIG. 137 Bernard Brewery Market Share
        FIG. 138 Pierre Chavin Revenue and Growth Rate
        FIG. 139 Pierre Chavin Market Share
        FIG. 140 Suntory Brewery Co. Ltd. Revenue and Growth Rate
        FIG. 141 Suntory Brewery Co. Ltd. Market Share
        FIG. 142 Krombacher Brauerei Revenue and Growth Rate
        FIG. 143 Krombacher Brauerei Market Share
        FIG. 144 Market Dynamics
        FIG. 145 Global Non-Alcoholic Wine and Beer – Value Chain Analysis
        FIG. 146 Key Mandates and Regulations
        FIG. 147 Technology Roadmap and Timeline
        FIG. 148 Market Attractiveness Analysis – By Product
        FIG. 149 Market Attractiveness Analysis – By Material
        FIG. 150 Market Attractiveness Analysis – By Type
        FIG. 151 Market Attractiveness Analysis – By Technology
        FIG. 152 Market Attractiveness Analysis – By Sales Stores
        FIG. 153 Market Attractiveness Analysis – By Region
        FIG. 154 Manufacturing Cost Structure of Non-Alcoholic Wine and Beer
        FIG. 155 Non-Alcoholic Wine and Beer Industrial Chain Analysis
        FIG. 156 Market Channel
        FIG. 157 Marketing Channel Development Trend
        FIG. 158 Growth in World Gross Product, 2008-2018

        List of Tables

        TABLE 1 Global Non-Alcoholic Wine and Beer market, 2018& 2025 (USD Billion)
        TABLE 2 Global Non-Alcoholic Wine and Beer market, by Product, 2016-2026 (USD Billion)
        TABLE 3 Global Non-Alcoholic Wine and Beer market, by Product, 2016-2026 (Million Liters)
        TABLE 4 Global Non-Alcoholic Wine and Beer market, by Material, 2016-2026 (USD Billion)
        TABLE 5 Global Non-Alcoholic Wine and Beer market, by Material, 2016-2026 (Million Liters)
        TABLE 6 Global Non-Alcoholic Wine and Beer market, by Type, 2016-2026 (USD Billion)
        TABLE 7 Global Non-Alcoholic Wine and Beer market, by Type, 2016-2026 (Million Liters)
        TABLE 8 Global Non-Alcoholic Wine and Beer market, by Technology, 2016-2026 (USD Billion)
        TABLE 9 Global Non-Alcoholic Wine and Beer market, by Technology, 2016-2026 (Million Liters)
        TABLE 10 Global Non-Alcoholic Wine and Beer market, by Sales Stores, 2016-2026 (USD Billion)
        TABLE 11 Global Non-Alcoholic Wine and Beer market, by Sales Stores, 2016-2026 (Million Liters)
        TABLE 12 Global Non-Alcoholic Wine and Beer market, by region, 2016-2026 (USD Billion)
        TABLE 13 Global Non-Alcoholic Wine and Beer market, by region, 2016-2026 (Million Liters)
        TABLE 14 North AmericaNon-Alcoholic Wine and Beer Market, by Product, 2016-2026 (USD Billion)
        TABLE 15 North AmericaNon-Alcoholic Wine and Beer Market, by Product, 2016-2026 (Million Liters)
        TABLE 16 North AmericaNon-Alcoholic Wine and Beer Market, by Material, 2016-2026 (USD Billion)
        TABLE 17 North AmericaNon-Alcoholic Wine and Beer Market, by Material, 2016-2026 (Million Liters)
        TABLE 18 North AmericaNon-Alcoholic Wine and Beer Market, by Type, 2016-2026 (USD Billion)
        TABLE 19 North AmericaNon-Alcoholic Wine and Beer Market, by Type, 2016-2026 (Million Liters)
        TABLE 20 North AmericaNon-Alcoholic Wine and Beer Market, by Technology, 2016-2026 (USD Billion)
        TABLE 21 North AmericaNon-Alcoholic Wine and Beer Market, by Technology, 2016-2026 (Million Liters)
        TABLE 22 North AmericaNon-Alcoholic Wine and Beer Market, by Sales Stores, 2016-2026 (USD Billion)
        TABLE 23 North AmericaNon-Alcoholic Wine and Beer Market, by Sales Stores, 2016-2026 (Million Liters)
        TABLE 24 EuropeNon-Alcoholic Wine and Beer Market, by Product, 2016-2026 (USD Billion)
        TABLE 25 EuropeNon-Alcoholic Wine and Beer Market, by Product, 2016-2026 (Million Liters)
        TABLE 26 EuropeNon-Alcoholic Wine and Beer Market, by Material, 2016-2026 (USD Billion)
        TABLE 27 EuropeNon-Alcoholic Wine and Beer Market, by Material, 2016-2026 (Million Liters)
        TABLE 28 EuropeNon-Alcoholic Wine and Beer Market, by Type, 2016-2026 (USD Billion)
        TABLE 29 EuropeNon-Alcoholic Wine and Beer Market, by Type, 2016-2026 (Million Liters)
        TABLE 30 EuropeNon-Alcoholic Wine and Beer Market, by Technology, 2016-2026 (USD Billion)
        TABLE 31 EuropeNon-Alcoholic Wine and Beer Market, by Technology, 2016-2026 (Million Liters)
        TABLE 32 EuropeNon-Alcoholic Wine and Beer Market, by Sales Stores, 2016-2026 (USD Billion)
        TABLE 33 EuropeNon-Alcoholic Wine and Beer Market, by Sales Stores, 2016-2026 (Million Liters)
        TABLE 34 Asia PacificNon-Alcoholic Wine and Beer Market, by Product, 2016-2026 (USD Billion)
        TABLE 35 Asia PacificNon-Alcoholic Wine and Beer Market, by Product, 2016-2026 (Million Liters)
        TABLE 36 Asia PacificNon-Alcoholic Wine and Beer Market, by Material, 2016-2026 (USD Billion)
        TABLE 37 Asia PacificNon-Alcoholic Wine and Beer Market, by Material, 2016-2026 (Million Liters)
        TABLE 38 Asia PacificNon-Alcoholic Wine and Beer Market, by Type, 2016-2026 (USD Billion)
        TABLE 39 Asia PacificNon-Alcoholic Wine and Beer Market, by Type, 2016-2026 (Million Liters)
        TABLE 40 Asia PacificNon-Alcoholic Wine and Beer Market, by Technology, 2016-2026 (USD Billion)
        TABLE 41 Asia PacificNon-Alcoholic Wine and Beer Market, by Technology, 2016-2026 (Million Liters)
        TABLE 42 Asia PacificNon-Alcoholic Wine and Beer Market, by Sales Stores, 2016-2026 (USD Billion)
        TABLE 43 Asia PacificNon-Alcoholic Wine and Beer Market, by Sales Stores, 2016-2026 (Million Liters)
        TABLE 44 Latin AmericaNon-Alcoholic Wine and Beer Market, by Product, 2016-2026 (USD Billion)
        TABLE 45 Latin AmericaNon-Alcoholic Wine and Beer Market, by Product, 2016-2026 (Million Liters)
        TABLE 46 Latin AmericaNon-Alcoholic Wine and Beer Market, by Material, 2016-2026 (USD Billion)
        TABLE 47 Latin AmericaNon-Alcoholic Wine and Beer Market, by Material, 2016-2026 (Million Liters)
        TABLE 48 Latin AmericaNon-Alcoholic Wine and Beer Market, by Type, 2016-2026 (USD Billion)
        TABLE 49 Latin AmericaNon-Alcoholic Wine and Beer Market, by Type, 2016-2026 (Million Liters)
        TABLE 50 Latin AmericaNon-Alcoholic Wine and Beer Market, by Technology, 2016-2026 (USD Billion)
        TABLE 51 Latin AmericaNon-Alcoholic Wine and Beer Market, by Technology, 2016-2026 (Million Liters)
        TABLE 52 Latin AmericaNon-Alcoholic Wine and Beer Market, by Sales Stores, 2016-2026 (USD Billion)
        TABLE 53 Latin AmericaNon-Alcoholic Wine and Beer Market, by Sales Stores, 2016-2026 (Million Liters)
        TABLE 54 The Middle-East and AfricaNon-Alcoholic Wine and Beer Market, by Product, 2016-2026 (USD Billion)
        TABLE 55 The Middle-East and AfricaNon-Alcoholic Wine and Beer Market, by Product, 2016-2026 (Million Liters)
        TABLE 56 The Middle-East and AfricaNon-Alcoholic Wine and Beer Market, by Material, 2016-2026 (USD Billion)
        TABLE 57 The Middle-East and AfricaNon-Alcoholic Wine and Beer Market, by Material, 2016-2026 (Million Liters)
        TABLE 58 The Middle-East and AfricaNon-Alcoholic Wine and Beer Market, by Type, 2016-2026 (USD Billion)
        TABLE 59 The Middle-East and AfricaNon-Alcoholic Wine and Beer Market, by Type, 2016-2026 (Million Liters)
        TABLE 60 The Middle-East and AfricaNon-Alcoholic Wine and Beer Market, by Technology, 2016-2026 (USD Billion)
        TABLE 61 The Middle-East and AfricaNon-Alcoholic Wine and Beer Market, by Technology, 2016-2026 (Million Liters)
        TABLE 62 The Middle-East and AfricaNon-Alcoholic Wine and Beer Market, by Sales Stores, 2016-2026 (USD Billion)
        TABLE 63 The Middle-East and AfricaNon-Alcoholic Wine and Beer Market, by Sales Stores, 2016-2026 (Million Liters)
        TABLE 64 North America Non-Alcoholic Wine and BeerProduction, Consumption, Export, Import, 2016-2019
        TABLE 65 Europe Non-Alcoholic Wine and BeerProduction, Consumption, Export, Import, 2016-2019
        TABLE 66 Asia Pacific Non-Alcoholic Wine and BeerProduction, Consumption, Export, Import, 2016-2019
        TABLE 67 Latin America Non-Alcoholic Wine and BeerProduction, Consumption, Export, Import, 2016-2019
        TABLE 68 Middle East & Africa Non-Alcoholic Wine and BeerProduction, Consumption, Export, Import, 2016-2019
        TABLE 69 Global Non-Alcoholic Wine and Beer Market - Company Revenue Analysis 2016-2019 (USD Billion)
        TABLE 70 Global Non-Alcoholic Wine and Beer Market - Company Revenue Share Analysis 2016-2019(%)
        TABLE 71 Global Non-Alcoholic Wine and Beer Market - Company Volume Analysis 2016-2019 (Million Liters)
        TABLE 72 Global Non-Alcoholic Wine and Beer Market - Company Volume Share Analysis 2016-2019(%)
        TABLE 73 Acquisitions and Mergers
        TABLE 74 New Product/Service Launch
        TABLE 75 Research & Development Activities
        TABLE 76 Market Drivers
        TABLE 77 Market Restraints
        TABLE 78 Market Opportunities
        TABLE 79 Production Base and Market Concentration Rate of Raw Material
        TABLE 80 Key Suppliers of Raw Materials
        TABLE 81 Raw Materials Sources of Non-Alcoholic Wine and Beer Major Manufacturers in 2016
        TABLE 82 Major Buyers of Non-Alcoholic Wine and Beer
        TABLE 83 Distributors/Traders of Non-Alcoholic Wine and Beer by Region

Industry Major Market Players

  • Erdinger
  •  Moscow Brewery Company
  •  Carlsberg
  •  Arpanoosh
  •  Bayerische Staatsbrauerei Weihenstepha
  •  Big Drop Brewing Co Ltd.
  •  S. Martinelli & Company
  •  Anheuser-Busch InBev
  •  Iran Behnoush Co.
  •  Burke Distribution Corporation
  •  J. Lohr Vineyards & Wines
  •  Kirin Holdings Company
  •  Heineken N.V
  •  Sutter Home Winery Inc.
  •  Coors Brewing Company
  •  Halewood Wines & Spirits
  •  Bernard Brewery
  •  Pierre Chavin
  •  Suntory Brewery Co. Ltd.
  •  and Krombacher Brauerei