Search Market Research Report

Discover Our Latest Reports
Discover Our Featured Reports
Discover Top Selling Reports

Surface Disinfectant Market Size, Share Global Analysis Report, 2020–2026

report img

Surface Disinfectant Market By Composition (Alcohols, Chlorine Compounds, Quaternary Ammonium Compounds, Hydrogen Peroxide, Peracetic Acid, and Other Compositions), By Type (Liquids, Wipes, and Sprays), By Application (Surface Disinfection, Instrument Disinfection, and Other Applications), By End-User (Hospital Settings, Diagnostic Laboratories, Pharmaceutical & Biotechnology Companies, and Research Laboratories): Global Industry Outlook, Market Size, Business Intelligence, Consumer Preferences, Statistical Surveys, Comprehensive Analysis, Historical Developments, Current Trends, and Forecast 2020–2026

Industry Insights

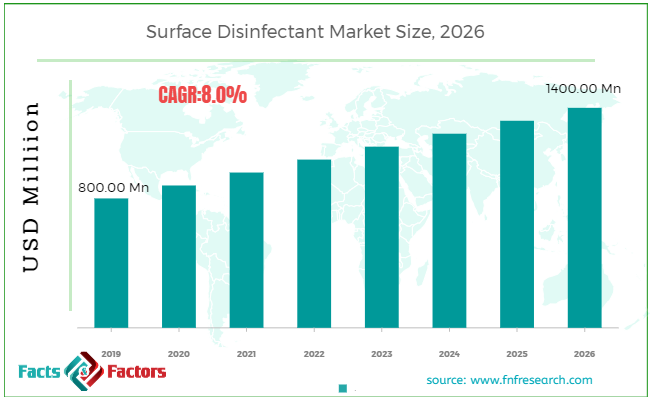
[220+ Pages Report] According to the report published by Facts Factors, the global surface disinfectant market size was worth around USD 800.00 million in 2019 and is predicted to grow to around USD 1400.00 million by 2026 with a compound annual growth rate (CAGR) of roughly 8.0% between 2020 and 2026. The report analyzes the global surface disinfectant market drivers, restraints/challenges, and the effect they have on the demands during the projection period. In addition, the report explores emerging opportunities in the surface disinfectant market.

Surface Disinfectant Market Size

To know more about this report | Request Free Sample Copy

This specialized and expertise-oriented industry research report scrutinizes the technical and commercial business outlook of the surface disinfectant industry. The report analyzes and declares the historical and current trends analysis of the surface disinfectant industry and subsequently recommends the projected trends anticipated to be observed in the surface disinfectant market during the upcoming years.

The surface disinfectant market report analyzes and notifies the industry statistics at the global as well as regional and country levels in order to acquire a thorough perspective of the entire surface disinfectant market. The historical and past insights are provided for FY 2016 to FY 2019 whereas projected trends are delivered for FY 2020 to FY 2026. The quantitative and numerical data is represented in terms of value (USD Million) and volume (Kilotons) from FY 2016 – 2026.


logoKey Insights from Primary Research

  • As per our primary respondents, the China surface disinfectant market is set to grow annually at a rate of around 8.0%
  • It was established through primary research that the U.S. surface disinfectant market was valued at more than USD 800.00 million in 2019
  • The increasing demand for surface disinfectants from various industries in China is supposed to display the highest growth in the regional market as it is one of the developed economies.
  • North American region accounted larger share of around 35.0% of the surface disinfectant market in 2019.
  • In 2019, the segment of liquid form led the industry and held around 60.0% of the global share. Liquid disinfectants are efficient against numerous forms of microbes that cause intracellular and respiratory disorders and injuries. These disinfectants are often used in routine hygiene processes as they can easily monitor the spread of bacteria, such as regular disinfection of pipes, utensils, and surfaces.
  • The Asia Pacific is witnessing significant growth in the global demand for surface disinfectants due to numerous aspects with increased incidences of infectious disease across the country, as well as an increased understanding of the aids of surface disinfectants. The regional administration is strongly engaged in setting up quality healthcare facilities with a specific focus on cleanliness and public health.

logoKey Recommendations from Analysts

  • Innovation in surface disinfectants is supposed to fuel market growth. Companies are supposed to invest in R&D to innovate better products. Product invention will open new opportunities for surface disinfectants and thus is expected to propel the industry demand in the upcoming years.
  • There is a huge demand for surface disinfectants in developing regions such as the Asia Pacific, which is driving the laboratories, and hospital centers in the regions.
  • North American region is anticipated to have a larger share of the surface disinfectant market through 2026 in terms of demand, followed by Europe and the Asia Pacific.
  • China's surface disinfectant market is anticipated to rise at the highest rate between 2020 and 2026.
  • Growing at a CAGR of around 8.0%, China's surface disinfectant market offers several opportunities for all of the involved investors crosswise the entire value chain
  • Because of the significant use of surface disinfectants in the healthcare sector, the healthcare market is expected to grow at a reasonably high CAGR.

logo
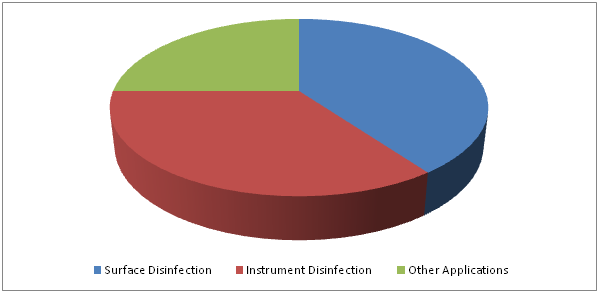
Global Surface Disinfectant Market Revenue Share In 2019– By Application

Surface Disinfectant Market

To know more about this report | Request Free Sample Copy


The quantitative data is further underlined and reinforced by comprehensive qualitative data which comprises various across-the-board market dynamics. The rationales which directly or indirectly impact the surface disinfectant industry are exemplified through parameters such as growth drivers, restraints, challenges, and opportunities among other impacting factors.

Throughout our research report, we have encompassed all the proven models and tools of industry analysis and extensively illustrated all the key business strategies and business models adopted in the surface disinfectant industry. The report provides an all-inclusive and detailed competitive landscape prevalent in the surface disinfectant market.

The report utilizes established industry analysis tools and models such as Porter’s Five Forces framework to analyze and recognize critical business strategies adopted by various stakeholders involved in the entire value chain of the surface disinfectant industry. The surface disinfectant market report additionally employs SWOT analysis and PESTLE analysis models for further in-depth analysis.

The report study further includes an in-depth analysis of industry players' market shares and provides an overview of leading players' market position in the surface disinfectant sector. Key strategic developments in the surface disinfectant market competitive landscape such as acquisitions & mergers, inaugurations of different products and services, partnerships & joint ventures, MoU agreements, VC & funding activities, R&D activities, and geographic expansion among other noteworthy activities by key players of the surface disinfectant market are appropriately highlighted in the report.

The global surface disinfectant market is experiencing significant growth that is expected to continue over the upcoming years. A massive rise in the demand for surface disinfectants in the healthcare industry sectors is likely to act as a key driver of the global surface disinfectant market.

The surface disinfectant market research report delivers an acute valuation and taxonomy of the surface disinfectant industry by practically splitting the market on the basis of different compositions, types, applications, end-user, and regions. Through the analysis of the historical and projected trends, all the segments and sub-segments were evaluated through the bottom-up approach, and different market sizes have been projected for FY 2020 to FY 2026.

logoReport Scope

Report Attribute

Details

Market Size in 2019

USD 800.00 Million

Projected Market Size in 2026

USD 1400.00 Million

CAGR Growth Rate

8.0% CAGR

Base Year

2019

Forecast Years

2020-2026

Key Market Players

Cantel Medical Corporation, 3M Group, The Clorox Company, Procter & Gamble, Ecolab Inc., Diversey, Inc., Reckitt Benckiser Group plc., CarrollCLEAN, STERIS plc, Whiteley Corporation, Metrex Research, LLC., PAUL HARTMANN AG, GOJO Industries, Inc., Pharmax Limited, Medline Industries, Inc., Betco, PDI Inc., MEDALKAN, GESCO Healthcare Pvt. Ltd., Contec Inc., Ruhof, Micro-Scientific, LLC, Cetylite, Inc., Pal International, and BHC, Inc., and Others

Key Segment

By Composition, Type, Application, End-User, and Region

Major Regions Covered

North America, Europe, Asia Pacific, Latin America, and the Middle East & Africa

Purchase Options

Request customized purchase options to meet your research needs. Explore purchase options

The regional segmentation of the surface disinfectant industry includes the complete classification of all the major continents including North America, Latin America, Europe, Asia Pacific, and the Middle East & Africa. Further, country-wise data for the surface disinfectant industry is provided for the leading economies of the world.

The surface disinfectant market is segmented based on composition, type, application, and end-user. On the basis of composition segmentation, the market is classified into alcohol, chlorine compounds, quaternary ammonium compounds, hydrogen peroxide, peracetic acid, and other compositions. On the basis of type segmentation, the market is classified into liquids, wipes, and sprays. On the basis of application segmentation, the market is classified into surface disinfection, instrument disinfection, and other applications. In terms of end-user segmentation, the market is bifurcated into hospital settings, diagnostic laboratories, pharmaceutical & biotechnology companies, and research laboratories.

logoSome of the essential players operating in the surface disinfectant market, but not restricted to include

  •  Cantel Medical Corporation
  •  3M Group
  •  The Clorox Company
  •  Procter & Gamble
  •  Ecolab Inc.
  •  Diversey Inc.
  •  Reckitt Benckiser Group plc.
  •  CarrollCLEAN
  •  STERIS plc
  •  Whiteley Corporation
  •  Metrex Research LLC.
  •  PAUL HARTMANN AG
  •  GOJO Industries Inc.
  •  Pharmax Limited
  •  Medline Industries Inc.
  •  Betco
  •  PDI Inc.
  •  MEDALKAN
  •  GESCO Healthcare Pvt. Ltd.
  •  Contec Inc.
  •  Ruhof
  •  Micro-Scientific LLC
  •  Cetylite Inc.
  •  Pal International

The taxonomy of the surface disinfectant industry by its scope and segmentation is as follows:

logo Composition Analysis

  • Alcohols
  • Chlorine Compounds
  • Quaternary Ammonium Compounds
  • Hydrogen Peroxide
  • Peracetic Acid
  • Other Compositions

logo Type Analysis

  • Liquids
  • Wipes
  • Sprays

logo Application Analysis

  • Surface Disinfection
  • Instrument Disinfection
  • Other Applications

logo End-User Analysis

  • Hospital Settings
  • Diagnostic Laboratories
  • Pharmaceutical & Biotechnology Companies
  • Research Laboratories

logo Regional Segmentation Analysis

  • North America
    • The U.S.
    • Canada
  • Europe
    • Germany
    • The UK
    • France
    • Spain
    • Italy
    • Rest of Europe
  • Asia Pacific
    • China
    • Japan
    • India
    • South Korea
    • Southeast Asia
    • Rest of Asia Pacific
  • Latin America
    • Brazil
    • Mexico
    • Rest of Latin America
  • Middle East & Africa
    • GCC
    • South Africa
    • Rest of Middle East & Africa

Table of Content

  1. Chapter 1 Executive Summary
    1. 1.1. Introduction of Surface Disinfectant
    2. 1.2. Global Surface Disinfectant Market, 2019 & 2026 (USD Million)
    3. 1.3. Global Surface Disinfectant Market, 2016 – 2026 (USD Million) (Kilotons)
    4. 1.4. Global Surface Disinfectant Market Absolute Revenue Opportunity, 2016 – 2026 (USD Million)
    5. 1.5. Global Surface Disinfectant Market Incremental Revenue Opportunity, 2020 – 2026 (USD Million)
  2. Chapter 2 Surface Disinfectant Market – Composition Analysis
    1. 2.1. Global Surface Disinfectant Market – Composition Overview
    2. 2.2. Global Surface Disinfectant Market Share, by Composition, 2019 & 2026 (USD Million)
    3. 2.3. Global Surface Disinfectant Market share, by Composition, 2019 & 2026 (Kilotons)
    4. 2.4. Alcohols
      1. 2.4.1. Global Alcohols Surface Disinfectant Market, 2016 – 2026 (USD Million)
      2. 2.4.2. Global Alcohols Surface Disinfectant Market, 2016 – 2026 (Kilotons)
    5. 2.5. Chlorine Compounds
      1. 2.5.1. Global Chlorine Compounds Surface Disinfectant Market, 2016 – 2026 (USD Million)
      2. 2.5.2. Global Chlorine Compounds Surface Disinfectant Market, 2016 – 2026 (Kilotons)
    6. 2.6. Quaternary Ammonium Compounds
      1. 2.6.1. Global Quaternary Ammonium Compounds Surface Disinfectant Market, 2016 – 2026 (USD Million)
      2. 2.6.2. Global Quaternary Ammonium Compounds Surface Disinfectant Market, 2016 – 2026 (Kilotons)
    7. 2.7. Hydrogen Peroxide
      1. 2.7.1. Global Hydrogen Peroxide Surface Disinfectant Market, 2016 – 2026 (USD Million)
      2. 2.7.2. Global Hydrogen Peroxide Surface Disinfectant Market, 2016 – 2026 (Kilotons)
    8. 2.8. Peracetic Acid
      1. 2.8.1. Global Peracetic Acid Surface Disinfectant Market, 2016 – 2026 (USD Million)
      2. 2.8.2. Global Peracetic Acid Surface Disinfectant Market, 2016 – 2026 (Kilotons)
    9. 2.9. Other Compositions
      1. 2.9.1. Global Other Compositions Surface Disinfectant Market, 2016 – 2026 (USD Million)
      2. 2.9.2. Global Other Compositions Surface Disinfectant Market, 2016 – 2026 (Kilotons)
  3. Chapter 3 Surface Disinfectant Market – Type Analysis
    1. 3.1. Global Surface Disinfectant Market – Type Overview
    2. 3.2. Global Surface Disinfectant Market Share, by Type, 2019 & 2026 (USD Million)
    3. 3.3. Global Surface Disinfectant Market share, by Type, 2019 & 2026 (Kilotons)
    4. 3.4. Liquids
      1. 3.4.1. Global Liquids Surface Disinfectant Market, 2016 – 2026 (USD Million)
      2. 3.4.2. Global Liquids Surface Disinfectant Market, 2016 – 2026 (Kilotons)
    5. 3.5. Wipes
      1. 3.5.1. Global Wipes Surface Disinfectant Market, 2016 – 2026 (USD Million)
      2. 3.5.2. Global Wipes Surface Disinfectant Market, 2016 – 2026 (Kilotons)
    6. 3.6. Sprays
      1. 3.6.1. Global Sprays Surface Disinfectant Market, 2016 – 2026 (USD Million)
      2. 3.6.2. Global Sprays Surface Disinfectant Market, 2016 – 2026 (Kilotons)
  4. Chapter 4 Surface Disinfectant Market – Application Analysis
    1. 4.1. Global Surface Disinfectant Market – Application Overview
    2. 4.2. Global Surface Disinfectant Market Share, by Application, 2019 & 2026 (USD Million)
    3. 4.3. Global Surface Disinfectant Market share, by Application, 2019 & 2026 (Kilotons)
    4. 4.4. Surface Disinfection
      1. 4.4.1. Global Surface Disinfection Surface Disinfectant Market, 2016 – 2026 (USD Million)
      2. 4.4.2. Global Surface Disinfection Surface Disinfectant Market, 2016 – 2026 (Kilotons)
    5. 4.5. Instrument Disinfection
      1. 4.5.1. Global Instrument Disinfection Surface Disinfectant Market, 2016 – 2026 (USD Million)
      2. 4.5.2. Global Instrument Disinfection Surface Disinfectant Market, 2016 – 2026 (Kilotons)
    6. 4.6. Other Applications
      1. 4.6.1. Global Other Applications Surface Disinfectant Market, 2016 – 2026 (USD Million)
      2. 4.6.2. Global Other Applications Surface Disinfectant Market, 2016 – 2026 (Kilotons)
  5. Chapter 5 Surface Disinfectant Market – End-User Analysis
    1. 5.1. Global Surface Disinfectant Market – End-User Overview
    2. 5.2. Global Surface Disinfectant Market Share, by End-User, 2019 & 2026 (USD Million)
    3. 5.3. Global Surface Disinfectant Market share, by End-User, 2019 & 2026 (Kilotons)
    4. 5.4. Hospital Settings
      1. 5.4.1. Global Hospital Settings Surface Disinfectant Market, 2016 – 2026 (USD Million)
      2. 5.4.2. Global Hospital Settings Surface Disinfectant Market, 2016 – 2026 (Kilotons)
    5. 5.5. Diagnostic Laboratories
      1. 5.5.1. Global Diagnostic Laboratories Surface Disinfectant Market, 2016 – 2026 (USD Million)
      2. 5.5.2. Global Diagnostic Laboratories Surface Disinfectant Market, 2016 – 2026 (Kilotons)
    6. 5.6. Pharmaceutical & Biotechnology Companies
      1. 5.6.1. Global Pharmaceutical & Biotechnology Companies Surface Disinfectant Market, 2016 – 2026 (USD Million)
      2. 5.6.2. Global Pharmaceutical & Biotechnology Companies Surface Disinfectant Market, 2016 – 2026 (Kilotons)
    7. 5.7. Research Laboratories
      1. 5.7.1. Global Research Laboratories Surface Disinfectant Market, 2016 – 2026 (USD Million)
      2. 5.7.2. Global Research Laboratories Surface Disinfectant Market, 2016 – 2026 (Kilotons)
  6. Chapter 6 Surface Disinfectant Market – Regional Analysis
    1. 6.1. Global Surface Disinfectant Market Regional Overview
    2. 6.2. Global Surface Disinfectant Market Share, by Region, 2019 & 2026 (USD Million)
    3. 6.3. Global Surface Disinfectant Market Share, by Region, 2019 & 2026 (Kilotons)
    4. 6.4. North America
      1. 6.4.1. North America Surface Disinfectant Market, 2016 – 2026 (USD Million)
        1. 6.4.1.1. North America Surface Disinfectant Market, by Country, 2016 – 2026 (USD Million)
      2. 6.4.2. North America Market, 2016 – 2026 (Kilotons)
        1. 6.4.2.1. North America Surface Disinfectant Market, by Country, 2016 – 2026 (Kilotons)
      3. 6.4.3. North America Surface Disinfectant Market, by Composition, 2016 – 2026
        1. 6.4.3.1. North America Surface Disinfectant Market, by Composition, 2016 – 2026 (USD Million)
        2. 6.4.3.2. North America Surface Disinfectant Market, by Composition, 2016 – 2026 (Kilotons)
      4. 6.4.4. North America Surface Disinfectant Market, by Type, 2016 – 2026
        1. 6.4.4.1. North America Surface Disinfectant Market, by Type, 2016 – 2026 (USD Million)
        2. 6.4.4.2. North America Surface Disinfectant Market, by Type, 2016 – 2026 (Kilotons)
      5. 6.4.5. North America Surface Disinfectant Market, by Application, 2016 – 2026
        1. 6.4.5.1. North America Surface Disinfectant Market, by Application, 2016 – 2026 (USD Million)
        2. 6.4.5.2. North America Surface Disinfectant Market, by Application, 2016 – 2026 (Kilotons)
      6. 6.4.6. North America Surface Disinfectant Market, by End-User, 2016 – 2026
        1. 6.4.6.1. North America Surface Disinfectant Market, by End-User, 2016 – 2026 (USD Million)
        2. 6.4.6.2. North America Surface Disinfectant Market, by End-User, 2016 – 2026 (Kilotons)
      7. 6.4.7. U.S.
        1. 6.4.7.1. U.S. Surface Disinfectant Market, 2016 – 2026 (USD Million)
        2. 6.4.7.2. U.S. Surface Disinfectant Market, 2016 – 2026 (Kilotons)
      8. 6.4.8. Canada
        1. 6.4.8.1. Canada Surface Disinfectant Market, 2016 – 2026 (USD Million)
        2. 6.4.8.2. Canada Surface Disinfectant Market, 2016 – 2026 (Kilotons)
    5. 6.5. Europe
      1. 6.5.1. Europe Surface Disinfectant Market, 2016 – 2026 (USD Million)
        1. 6.5.1.1. Europe Surface Disinfectant Market, by Country, 2016 – 2026 (USD Million)
      2. 6.5.2. Europe Market, 2016 – 2026 (Kilotons)
        1. 6.5.2.1. Europe Surface Disinfectant Market, by Country, 2016 – 2026 (Kilotons)
      3. 6.5.3. Europe Surface Disinfectant Market, by Composition, 2016 – 2026
        1. 6.5.3.1. Europe Surface Disinfectant Market, by Composition, 2016 – 2026 (USD Million)
        2. 6.5.3.2. Europe Surface Disinfectant Market, by Composition, 2016 – 2026 (Kilotons)
      4. 6.5.4. Europe Surface Disinfectant Market, by Type, 2016 – 2026
        1. 6.5.4.1. Europe Surface Disinfectant Market, by Type, 2016 – 2026 (USD Million)
        2. 6.5.4.2. Europe Surface Disinfectant Market, by Type, 2016 – 2026 (Kilotons)
      5. 6.5.5. Europe Surface Disinfectant Market, by Application, 2016 – 2026
        1. 6.5.5.1. Europe Surface Disinfectant Market, by Application, 2016 – 2026 (USD Million)
        2. 6.5.5.2. Europe Surface Disinfectant Market, by Application, 2016 – 2026 (Kilotons)
      6. 6.5.6. Europe Surface Disinfectant Market, by End-User, 2016 – 2026
        1. 6.5.6.1. Europe Surface Disinfectant Market, by End-User, 2016 – 2026 (USD Million)
        2. 6.5.6.2. Europe Surface Disinfectant Market, by End-User, 2016 – 2026 (Kilotons)
      7. 6.5.7. Germany
        1. 6.5.7.1. Germany Surface Disinfectant Market, 2016 – 2026 (USD Million)
        2. 6.5.7.2. Germany Surface Disinfectant Market, 2016 – 2026 (Kilotons)
      8. 6.5.8. France
        1. 6.5.8.1. France Surface Disinfectant Market, 2016 – 2026 (USD Million)
        2. 6.5.8.2. France Surface Disinfectant Market, 2016 – 2026 (Kilotons)
      9. 6.5.9. U.K.
        1. 6.5.9.1. U.K. Surface Disinfectant Market, 2016 – 2026 (USD Million)
        2. 6.5.9.2. U.K. Surface Disinfectant Market, 2016 – 2026 (Kilotons)
      10. 6.5.10. Italy
        1. 6.5.10.1. Italy Surface Disinfectant Market, 2016 – 2026 (USD Million)
        2. 6.5.10.2. Italy Surface Disinfectant Market, 2016 – 2026 (Kilotons)
      11. 6.5.11. Spain
        1. 6.5.11.1. Spain Surface Disinfectant Market, 2016 – 2026 (USD Million)
        2. 6.5.11.2. Spain Surface Disinfectant Market, 2016 – 2026 (Kilotons)
      12. 6.5.12. Rest of Europe
        1. 6.5.12.1. Rest of Europe Surface Disinfectant Market, 2016 – 2026 (USD Million)
        2. 6.5.12.2. Rest of Europe Surface Disinfectant Market, 2016 – 2026 (Kilotons)
    6. 6.6. Asia Pacific
      1. 6.6.1. Asia Pacific Surface Disinfectant Market, 2016 – 2026 (USD Million)
        1. 6.6.1.1. Asia Pacific Surface Disinfectant Market, by Country, 2016 – 2026 (USD Million)
      2. 6.6.2. Asia Pacific Market, 2016 – 2026 (Kilotons)
        1. 6.6.2.1. Asia Pacific Surface Disinfectant Market, by Country, 2016 – 2026 (Kilotons)
      3. 6.6.3. Asia Pacific Surface Disinfectant Market, by Composition, 2016 – 2026
        1. 6.6.3.1. Asia Pacific Surface Disinfectant Market, by Composition, 2016 – 2026 (USD Million)
        2. 6.6.3.2. Asia Pacific Surface Disinfectant Market, by Composition, 2016 – 2026 (Kilotons)
      4. 6.6.4. Asia Pacific Surface Disinfectant Market, by Type, 2016 – 2026
        1. 6.6.4.1. Asia Pacific Surface Disinfectant Market, by Type, 2016 – 2026 (USD Million)
        2. 6.6.4.2. Asia Pacific Surface Disinfectant Market, by Type, 2016 – 2026 (Kilotons)
      5. 6.6.5. Asia Pacific Surface Disinfectant Market, by Application, 2016 – 2026
        1. 6.6.5.1. Asia Pacific Surface Disinfectant Market, by Application, 2016 – 2026 (USD Million)
        2. 6.6.5.2. Asia Pacific Surface Disinfectant Market, by Application, 2016 – 2026 (Kilotons)
      6. 6.6.6. Asia Pacific Surface Disinfectant Market, by End-User, 2016 – 2026
        1. 6.6.6.1. Asia Pacific Surface Disinfectant Market, by End-User, 2016 – 2026 (USD Million)
        2. 6.6.6.2. Asia Pacific Surface Disinfectant Market, by End-User, 2016 – 2026 (Kilotons)
      7. 6.6.7. China
        1. 6.6.7.1. China Surface Disinfectant Market, 2016 – 2026 (USD Million)
        2. 6.6.7.2. China Surface Disinfectant Market, 2016 – 2026 (Kilotons)
      8. 6.6.8. Japan
        1. 6.6.8.1. Japan Surface Disinfectant Market, 2016 – 2026 (USD Million)
        2. 6.6.8.2. Japan Surface Disinfectant Market, 2016 – 2026 (Kilotons)
      9. 6.6.9. India
        1. 6.6.9.1. India Surface Disinfectant Market, 2016 – 2026 (USD Million)
        2. 6.6.9.2. India Surface Disinfectant Market, 2016 – 2026 (Kilotons)
      10. 6.6.10. South Korea
        1. 6.6.10.1. South Korea Surface Disinfectant Market, 2016 – 2026 (USD Million)
        2. 6.6.10.2. South Korea Surface Disinfectant Market, 2016 – 2026 (Kilotons)
      11. 6.6.11. South-East Asia
        1. 6.6.11.1. South-East Asia Surface Disinfectant Market, 2016 – 2026 (USD Million)
        2. 6.6.11.2. South-East Asia Surface Disinfectant Market, 2016 – 2026 (Kilotons)
      12. 6.6.12. Rest of Asia Pacific
        1. 6.6.12.1. Rest of Asia Pacific Surface Disinfectant Market, 2016 – 2026 (USD Million)
        2. 6.6.12.2. Rest of Asia Pacific Surface Disinfectant Market, 2016 – 2026 (Kilotons)
    7. 6.7. Latin America
      1. 6.7.1. Latin America Surface Disinfectant Market, 2016 – 2026 (USD Million)
        1. 6.7.1.1. Latin America Surface Disinfectant Market, by Country, 2016 – 2026 (USD Million)
      2. 6.7.2. Latin America Market, 2016 – 2026 (Kilotons)
        1. 6.7.2.1. Latin America Surface Disinfectant Market, by Country, 2016 – 2026 (Kilotons)
      3. 6.7.3. Latin America Surface Disinfectant Market, by Composition, 2016 – 2026
        1. 6.7.3.1. Latin America Surface Disinfectant Market, by Composition, 2016 – 2026 (USD Million)
        2. 6.7.3.2. Latin America Surface Disinfectant Market, by Composition, 2016 – 2026 (Kilotons)
      4. 6.7.4. Latin America Surface Disinfectant Market, by Type, 2016 – 2026
        1. 6.7.4.1. Latin America Surface Disinfectant Market, by Type, 2016 – 2026 (USD Million)
        2. 6.7.4.2. Latin America Surface Disinfectant Market, by Type, 2016 – 2026 (Kilotons)
      5. 6.7.5. Latin America Surface Disinfectant Market, by Application, 2016 – 2026
        1. 6.7.5.1. Latin America Surface Disinfectant Market, by Application, 2016 – 2026 (USD Million)
        2. 6.7.5.2. Latin America Surface Disinfectant Market, by Application, 2016 – 2026 (Kilotons)
      6. 6.7.6. Latin America Surface Disinfectant Market, by End-User, 2016 – 2026
        1. 6.7.6.1. Latin America Surface Disinfectant Market, by End-User, 2016 – 2026 (USD Million)
        2. 6.7.6.2. Latin America Surface Disinfectant Market, by End-User, 2016 – 2026 (Kilotons)
      7. 6.7.7. Brazil
        1. 6.7.7.1. Brazil Surface Disinfectant Market, 2016 – 2026 (USD Million)
        2. 6.7.7.2. Brazil Surface Disinfectant Market, 2016 – 2026 (Kilotons)
      8. 6.7.8. Mexico
        1. 6.7.8.1. Mexico Surface Disinfectant Market, 2016 – 2026 (USD Million)
        2. 6.7.8.2. Mexico Surface Disinfectant Market, 2016 – 2026 (Kilotons)
      9. 6.7.9. Rest of Latin America
        1. 6.7.9.1. Rest of Latin America Surface Disinfectant Market, 2016 – 2026 (USD Million)
        2. 6.7.9.2. Rest of Latin America Surface Disinfectant Market, 2016 – 2026 (Kilotons)
    8. 6.8. The Middle-East and Africa
      1. 6.8.1. The Middle-East and Africa Surface Disinfectant Market, 2016 – 2026 (USD Million)
        1. 6.8.1.1. The Middle-East and Africa Surface Disinfectant Market, by Country, 2016 – 2026 (USD Million)
      2. 6.8.2. The Middle-East and Africa Market, 2016 – 2026 (Kilotons)
        1. 6.8.2.1. The Middle-East and Africa Surface Disinfectant Market, by Country, 2016 – 2026 (Kilotons)
      3. 6.8.3. The Middle-East and Africa Surface Disinfectant Market, by Composition, 2016 – 2026
        1. 6.8.3.1. The Middle-East and Africa Surface Disinfectant Market, by Composition, 2016 – 2026 (USD Million)
        2. 6.8.3.2. The Middle-East and Africa Surface Disinfectant Market, by Composition, 2016 – 2026 (Kilotons)
      4. 6.8.4. The Middle-East and Africa Surface Disinfectant Market, by Type, 2016 – 2026
        1. 6.8.4.1. The Middle-East and Africa Surface Disinfectant Market, by Type, 2016 – 2026 (USD Million)
        2. 6.8.4.2. The Middle-East and Africa Surface Disinfectant Market, by Type, 2016 – 2026 (Kilotons)
      5. 6.8.5. The Middle-East and Africa Surface Disinfectant Market, by Application, 2016 – 2026
        1. 6.8.5.1. The Middle-East and Africa Surface Disinfectant Market, by Application, 2016 – 2026 (USD Million)
        2. 6.8.5.2. The Middle-East and Africa Surface Disinfectant Market, by Application, 2016 – 2026 (Kilotons)
      6. 6.8.6. The Middle-East and Africa Surface Disinfectant Market, by End-User, 2016 – 2026
        1. 6.8.6.1. The Middle-East and Africa Surface Disinfectant Market, by End-User, 2016 – 2026 (USD Million)
        2. 6.8.6.2. The Middle-East and Africa Surface Disinfectant Market, by End-User, 2016 – 2026 (Kilotons)
      7. 6.8.7. GCC Countries
        1. 6.8.7.1. GCC Countries Surface Disinfectant Market, 2016 – 2026 (USD Million)
        2. 6.8.7.2. GCC Countries Surface Disinfectant Market, 2016 – 2026 (Kilotons)
      8. 6.8.8. South Africa
        1. 6.8.8.1. South Africa Surface Disinfectant Market, 2016 – 2026 (USD Million)
        2. 6.8.8.2. South Africa Surface Disinfectant Market, 2016 – 2026 (Kilotons)
      9. 6.8.9. Rest of Middle-East Africa
        1. 6.8.9.1. Rest of Middle-East Africa Surface Disinfectant Market, 2016 – 2026 (USD Million)
        2. 6.8.9.2. Rest of Middle-East Africa Surface Disinfectant Market, 2016 – 2026 (Kilotons)
  7. Chapter 7 Surface Disinfectant Production, Consumption, Export, Import by Regions
    1. 7.1. Global Surface Disinfectant Production and Consumption, 2016 – 2026 (Kilotons)
    2. 7.2. Global Import and Export Analysis, by Region
  8. Chapter 8 Surface Disinfectant Market – Competitive Landscape
    1. 8.1. Competitor Market Share – Revenue
    2. 8.2. Market Concentration Rate Analysis, Top 3 and Top 5 Players
    3. 8.3. Competitor Market Share – Volume
    4. 8.4. Strategic Developments
      1. 8.4.1. Acquisitions and Mergers
      2. 8.4.2. New Products
      3. 8.4.3. Research & Development Activities
  9. Chapter 9 Company Profiles
    1. 9.1. 3M Group
      1. 9.1.1. Company Overview
      2. 9.1.2. Product/Service Portfolio
      3. 9.1.3. 3M Group Sales, Revenue, Price, and Gross Margin
      4. 9.1.4. 3M Group Revenue and Growth Rate
      5. 9.1.5. 3M Group Market Share
      6. 9.1.6. Recent Initiatives, Funding/VC Activities, and Technological Innovations
    2. 9.2. Cantel Medical Corporation
      1. 9.2.1. Company Overview
      2. 9.2.2. Product/Service Portfolio
      3. 9.2.3. Cantel Medical Corporation Sales, Revenue, Price, and Gross Margin
      4. 9.2.4. Cantel Medical Corporation Revenue and Growth Rate
      5. 9.2.5. Cantel Medical Corporation Market Share
      6. 9.2.6. Recent Initiatives, Funding/VC Activities, and Technological Innovations
    3. 9.3. The Clorox Company
      1. 9.3.1. Company Overview
      2. 9.3.2. Product/Service Portfolio
      3. 9.3.3. The Clorox Company Sales, Revenue, Price, and Gross Margin
      4. 9.3.4. The Clorox Company Revenue and Growth Rate
      5. 9.3.5. The Clorox Company Market Share
      6. 9.3.6. Recent Initiatives, Funding/VC Activities, and Technological Innovations
    4. 9.4. Ecolab Inc.
      1. 9.4.1. Company Overview
      2. 9.4.2. Product/Service Portfolio
      3. 9.4.3. Ecolab Inc. Sales, Revenue, Price, and Gross Margin
      4. 9.4.4. Ecolab Inc. Revenue and Growth Rate
      5. 9.4.5. Ecolab Inc. Market Share
      6. 9.4.6. Recent Initiatives, Funding/VC Activities, and Technological Innovations
    5. 9.5. Procter & Gamble
      1. 9.5.1. Company Overview
      2. 9.5.2. Product/Service Portfolio
      3. 9.5.3. Procter & Gamble Sales, Revenue, Price, and Gross Margin
      4. 9.5.4. Procter & Gamble Revenue and Growth Rate
      5. 9.5.5. Procter & Gamble Market Share
      6. 9.5.6. Recent Initiatives, Funding/VC Activities, and Technological Innovations
    6. 9.6. Reckitt Benckiser Group plc.
      1. 9.6.1. Company Overview
      2. 9.6.2. Product/Service Portfolio
      3. 9.6.3. Reckitt Benckiser Group plc. Sales, Revenue, Price, and Gross Margin
      4. 9.6.4. Reckitt Benckiser Group plc. Revenue and Growth Rate
      5. 9.6.5. Reckitt Benckiser Group plc. Market Share
      6. 9.6.6. Recent Initiatives, Funding/VC Activities, and Technological Innovations
    7. 9.7. Diversey, Inc.
      1. 9.7.1. Company Overview
      2. 9.7.2. Product/Service Portfolio
      3. 9.7.3. Diversey, Inc. Sales, Revenue, Price, and Gross Margin
      4. 9.7.4. Diversey, Inc. Revenue and Growth Rate
      5. 9.7.5. Diversey, Inc. Market Share
      6. 9.7.6. Recent Initiatives, Funding/VC Activities, and Technological Innovations
    8. 9.8. STERIS plc
      1. 9.8.1. Company Overview
      2. 9.8.2. Product/Service Portfolio
      3. 9.8.3. STERIS plc Sales, Revenue, Price, and Gross Margin
      4. 9.8.4. STERIS plc Revenue and Growth Rate
      5. 9.8.5. STERIS plc Market Share
      6. 9.8.6. Recent Initiatives, Funding/VC Activities, and Technological Innovations
    9. 9.9. CarrollCLEAN
      1. 9.9.1. Company Overview
      2. 9.9.2. Product/Service Portfolio
      3. 9.9.3. CarrollCLEAN Sales, Revenue, Price, and Gross Margin
      4. 9.9.4. CarrollCLEAN Revenue and Growth Rate
      5. 9.9.5. CarrollCLEAN Market Share
      6. 9.9.6. Recent Initiatives, Funding/VC Activities, and Technological Innovations
    10. 9.10. Metrex Research, LLC.
      1. 9.10.1. Company Overview
      2. 9.10.2. Product/Service Portfolio
      3. 9.10.3. Metrex Research, LLC. Sales, Revenue, Price, and Gross Margin
      4. 9.10.4. Metrex Research, LLC. Revenue and Growth Rate
      5. 9.10.5. Metrex Research, LLC. Market Share
      6. 9.10.6. Recent Initiatives, Funding/VC Activities, and Technological Innovations
    11. 9.11. Whiteley Corporation
      1. 9.11.1. Company Overview
      2. 9.11.2. Product/Service Portfolio
      3. 9.11.3. Whiteley Corporation Sales, Revenue, Price, and Gross Margin
      4. 9.11.4. Whiteley Corporation Revenue and Growth Rate
      5. 9.11.5. Whiteley Corporation Market Share
      6. 9.11.6. Recent Initiatives, Funding/VC Activities, and Technological Innovations
    12. 9.12. GOJO Industries, Inc.
      1. 9.12.1. Company Overview
      2. 9.12.2. Product/Service Portfolio
      3. 9.12.3. GOJO Industries, Inc. Sales, Revenue, Price, and Gross Margin
      4. 9.12.4. GOJO Industries, Inc. Revenue and Growth Rate
      5. 9.12.5. GOJO Industries, Inc. Market Share
      6. 9.12.6. Recent Initiatives, Funding/VC Activities, and Technological Innovations
    13. 9.13. PAUL HARTMANN AG
      1. 9.13.1. Company Overview
      2. 9.13.2. Product/Service Portfolio
      3. 9.13.3. PAUL HARTMANN AG Sales, Revenue, Price, and Gross Margin
      4. 9.13.4. PAUL HARTMANN AG Revenue and Growth Rate
      5. 9.13.5. PAUL HARTMANN AG Market Share
      6. 9.13.6. Recent Initiatives, Funding/VC Activities, and Technological Innovations
    14. 9.14. Medline Industries, Inc.
      1. 9.14.1. Company Overview
      2. 9.14.2. Product/Service Portfolio
      3. 9.14.3. Medline Industries, Inc. Sales, Revenue, Price, and Gross Margin
      4. 9.14.4. Medline Industries, Inc. Revenue and Growth Rate
      5. 9.14.5. Medline Industries, Inc. Market Share
      6. 9.14.6. Recent Initiatives, Funding/VC Activities, and Technological Innovations
    15. 9.15. Pharmax Limited
      1. 9.15.1. Company Overview
      2. 9.15.2. Product/Service Portfolio
      3. 9.15.3. Pharmax Limited Sales, Revenue, Price, and Gross Margin
      4. 9.15.4. Pharmax Limited Revenue and Growth Rate
      5. 9.15.5. Pharmax Limited Market Share
      6. 9.15.6. Recent Initiatives, Funding/VC Activities, and Technological Innovations
    16. 9.16. PDI Inc.
      1. 9.16.1. Company Overview
      2. 9.16.2. Product/Service Portfolio
      3. 9.16.3. PDI Inc. Sales, Revenue, Price, and Gross Margin
      4. 9.16.4. PDI Inc. Revenue and Growth Rate
      5. 9.16.5. PDI Inc. Market Share
      6. 9.16.6. Recent Initiatives, Funding/VC Activities, and Technological Innovations
    17. 9.17. Betco
      1. 9.17.1. Company Overview
      2. 9.17.2. Product/Service Portfolio
      3. 9.17.3. Betco Sales, Revenue, Price, and Gross Margin
      4. 9.17.4. Betco Revenue and Growth Rate
      5. 9.17.5. Betco Market Share
      6. 9.17.6. Recent Initiatives, Funding/VC Activities, and Technological Innovations
    18. 9.18. GESCO Healthcare Pvt. Ltd.
      1. 9.18.1. Company Overview
      2. 9.18.2. Product/Service Portfolio
      3. 9.18.3. GESCO Healthcare Pvt. Ltd. Sales, Revenue, Price, and Gross Margin
      4. 9.18.4. GESCO Healthcare Pvt. Ltd. Revenue and Growth Rate
      5. 9.18.5. GESCO Healthcare Pvt. Ltd. Market Share
      6. 9.18.6. Recent Initiatives, Funding/VC Activities, and Technological Innovations
    19. 9.19. MEDALKAN
      1. 9.19.1. Company Overview
      2. 9.19.2. Product/Service Portfolio
      3. 9.19.3. MEDALKAN Sales, Revenue, Price, and Gross Margin
      4. 9.19.4. MEDALKAN Revenue and Growth Rate
      5. 9.19.5. MEDALKAN Market Share
      6. 9.19.6. Recent Initiatives, Funding/VC Activities, and Technological Innovations
    20. 9.20. Ruhof
      1. 9.20.1. Company Overview
      2. 9.20.2. Product/Service Portfolio
      3. 9.20.3. Ruhof Sales, Revenue, Price, and Gross Margin
      4. 9.20.4. Ruhof Revenue and Growth Rate
      5. 9.20.5. Ruhof Market Share
      6. 9.20.6. Recent Initiatives, Funding/VC Activities, and Technological Innovations
    21. 9.21. Contec Inc.
      1. 9.21.1. Company Overview
      2. 9.21.2. Product/Service Portfolio
      3. 9.21.3. Contec Inc. Sales, Revenue, Price, and Gross Margin
      4. 9.21.4. Contec Inc. Revenue and Growth Rate
      5. 9.21.5. Contec Inc. Market Share
      6. 9.21.6. Recent Initiatives, Funding/VC Activities, and Technological Innovations
    22. 9.22. Cetylite, Inc.
      1. 9.22.1. Company Overview
      2. 9.22.2. Product/Service Portfolio
      3. 9.22.3. Cetylite, Inc. Sales, Revenue, Price, and Gross Margin
      4. 9.22.4. Cetylite, Inc. Revenue and Growth Rate
      5. 9.22.5. Cetylite, Inc. Market Share
      6. 9.22.6. Recent Initiatives, Funding/VC Activities, and Technological Innovations
    23. 9.23. Micro-Scientific, LLC
      1. 9.23.1. Company Overview
      2. 9.23.2. Product/Service Portfolio
      3. 9.23.3. Micro-Scientific, LLC Sales, Revenue, Price, and Gross Margin
      4. 9.23.4. Micro-Scientific, LLC Revenue and Growth Rate
      5. 9.23.5. Micro-Scientific, LLC Market Share
      6. 9.23.6. Recent Initiatives, Funding/VC Activities, and Technological Innovations
    24. 9.24. Pal International
      1. 9.24.1. Company Overview
      2. 9.24.2. Product/Service Portfolio
      3. 9.24.3. Pal International Sales, Revenue, Price, and Gross Margin
      4. 9.24.4. Pal International Revenue and Growth Rate
      5. 9.24.5. Pal International Market Share
      6. 9.24.6. Recent Initiatives, Funding/VC Activities, and Technological Innovations
    25. 9.25. BHC, Inc.
      1. 9.25.1. Company Overview
      2. 9.25.2. Product/Service Portfolio
      3. 9.25.3. BHC, Inc. Sales, Revenue, Price, and Gross Margin
      4. 9.25.4. BHC, Inc. Revenue and Growth Rate
      5. 9.25.5. BHC, Inc. Market Share
      6. 9.25.6. Recent Initiatives, Funding/VC Activities, and Technological Innovations
  10. Chapter 10 Surface Disinfectant — Industry Analysis
    1. 10.1. Introduction and Taxonomy
    2. 10.2. Surface Disinfectant Market – Key Trends
      1. 10.2.1. Market Drivers
      2. 10.2.2. Market Restraints
      3. 10.2.3. Market Opportunities
    3. 10.3. Value Chain Analysis
    4. 10.4. Key Mandates and Regulations
    5. 10.5. Technology Roadmap and Timeline
    6. 10.6. Surface Disinfectant Market – Attractiveness Analysis
      1. 10.6.1. By Composition
      2. 10.6.2. By Type
      3. 10.6.3. By Application
      4. 10.6.4. By End-User
      5. 10.6.5. By Region
  11. Chapter 11 Raw Material Analysis
    1. 11.1. Surface Disinfectant Key Raw Material Analysis
      1. 11.1.1. Key Raw Materials
      2. 11.1.2. Price Trend of Key Raw Materials
    2. 11.2. Key Suppliers of Raw Materials
    3. 11.3. Proportion of Manufacturing Cost Structure
      1. 11.3.1. Raw Materials Cost
      2. 11.3.2. Labor Cost
      3. 11.3.3. Manufacturing Expenses
      4. 11.3.4. Miscellaneous Expenses
    4. 11.4. Manufacturing Cost Analysis of Surface Disinfectant
  12. Chapter 12 Industrial Chain, Sourcing Strategy, and Downstream Buyers
    1. 12.1. Surface Disinfectant Industrial Chain Analysis
    2. 12.2. Upstream Raw Materials Sourcing
      1. 12.2.1. Risk Mitigation:
      2. 12.2.2. Supplier Relationships:
      3. 12.2.3. Business Processes:
      4. 12.2.4. Securing the Product:
    3. 12.3. Raw Materials Sources of Surface Disinfectant Major Manufacturers
    4. 12.4. Downstream Buyers
    5. 12.5. Distributors/Traders List
  13. Chapter 13 Marketing Strategy Analysis, Distributors
    1. 13.1. Marketing Channel
    2. 13.2. Direct Marketing
    3. 13.3. Indirect Marketing
    4. 13.4. Marketing Channel Development Trends
    5. 13.5. Economic/Political Environmental Change
  14. Chapter 14 Report Conclusion & Key Insights
    1. 14.1. Key Insights from Primary Interviews & Surveys Respondents
    2. 14.2. Key Takeaways from Analysts, Consultants, and Industry Leaders
  15. Chapter 15 Research Approach & Methodology
    1. 15.1. Report Description
    2. 15.2. Research Scope
    3. 15.3. Research Methodology
      1. 15.3.1. Secondary Research
      2. 15.3.2. Primary Research
      3. 15.3.3. Statistical Models
        1. 15.3.3.1. Company Share Analysis Model
        2. 15.3.3.2. Revenue Based Modeling
      4. 15.3.4. Research Limitations

      List of Figures

      Fig.1 Product Picture of Surface Disinfectant
      Fig.2 Global Surface Disinfectant Market, 2016 – 2026 (USD Million)
      Fig.3 Global Surface Disinfectant Market, 2016 – 2026 (Kilotons)
      Fig.4 Global Surface Disinfectant Market Absolute Revenue Opportunity, 2016 – 2026 (USD Million)
      Fig.5 Global Surface Disinfectant Market Incremental Revenue Opportunity, 2020 – 2026 (USD Million)
      Fig.6 Global Surface Disinfectant Market Share, by Composition, 2019 & 2026 (USD Million)
      Fig.7 Global Surface Disinfectant Market Share, by Composition, 2019 & 2026 (Kilotons)
      Fig.8 Global Alcohols Surface Disinfectant Market, 2016 – 2026 (USD Million)
      Fig.9 Global Alcohols Surface Disinfectant Market, 2016 – 2026 (Kilotons)
      Fig.10 Global Chlorine Compounds Surface Disinfectant Market, 2016 – 2026 (USD Million)
      Fig.11 Global Chlorine Compounds Surface Disinfectant Market, 2016 – 2026 (Kilotons)
      Fig.12 Global Quaternary Ammonium Compounds Surface Disinfectant Market, 2016 – 2026 (USD Million)
      Fig.13 Global Quaternary Ammonium Compounds Surface Disinfectant Market, 2016 – 2026 (Kilotons)
      Fig.14 Global Hydrogen Peroxide Surface Disinfectant Market, 2016 – 2026 (USD Million)
      Fig.15 Global Hydrogen Peroxide Surface Disinfectant Market, 2016 – 2026 (Kilotons)
      Fig.16 Global Peracetic Acid Surface Disinfectant Market, 2016 – 2026 (USD Million)
      Fig.17 Global Peracetic Acid Surface Disinfectant Market, 2016 – 2026 (Kilotons)
      Fig.18 Global Other Compositions Surface Disinfectant Market, 2016 – 2026 (USD Million)
      Fig.19 Global Other Compositions Surface Disinfectant Market, 2016 – 2026 (Kilotons)
      Fig.20 Global Surface Disinfectant Market Share, by Type, 2019 & 2026 (USD Million)
      Fig.21 Global Surface Disinfectant Market Share, by Type, 2019 & 2026 (Kilotons)
      Fig.22 Global Liquids Surface Disinfectant Market, 2016 – 2026 (USD Million)
      Fig.23 Global Liquids Surface Disinfectant Market, 2016 – 2026 (Kilotons)
      Fig.24 Global Wipes Surface Disinfectant Market, 2016 – 2026 (USD Million)
      Fig.25 Global Wipes Surface Disinfectant Market, 2016 – 2026 (Kilotons)
      Fig.26 Global Sprays Surface Disinfectant Market, 2016 – 2026 (USD Million)
      Fig.27 Global Sprays Surface Disinfectant Market, 2016 – 2026 (Kilotons)
      Fig.28 Global Surface Disinfectant Market Share, by Application, 2019 & 2026 (USD Million)
      Fig.29 Global Surface Disinfectant Market Share, by Application, 2019 & 2026 (Kilotons)
      Fig.30 Global Surface Disinfection Surface Disinfectant Market, 2016 – 2026 (USD Million)
      Fig.31 Global Surface Disinfection Surface Disinfectant Market, 2016 – 2026 (Kilotons)
      Fig.32 Global Instrument Disinfection Surface Disinfectant Market, 2016 – 2026 (USD Million)
      Fig.33 Global Instrument Disinfection Surface Disinfectant Market, 2016 – 2026 (Kilotons)
      Fig.34 Global Other Applications Surface Disinfectant Market, 2016 – 2026 (USD Million)
      Fig.35 Global Other Applications Surface Disinfectant Market, 2016 – 2026 (Kilotons)
      Fig.36 Global Surface Disinfectant Market Share, by End-User, 2019 & 2026 (USD Million)
      Fig.37 Global Surface Disinfectant Market Share, by End-User, 2019 & 2026 (Kilotons)
      Fig.38 Global Hospital Settings Surface Disinfectant Market, 2016 – 2026 (USD Million)
      Fig.39 Global Hospital Settings Surface Disinfectant Market, 2016 – 2026 (Kilotons)
      Fig.40 Global Diagnostic Laboratories Surface Disinfectant Market, 2016 – 2026 (USD Million)
      Fig.41 Global Diagnostic Laboratories Surface Disinfectant Market, 2016 – 2026 (Kilotons)
      Fig.42 Global Pharmaceutical & Biotechnology Companies Surface Disinfectant Market, 2016 – 2026 (USD Million)
      Fig.43 Global Pharmaceutical & Biotechnology Companies Surface Disinfectant Market, 2016 – 2026 (Kilotons)
      Fig.44 Global Research Laboratories Surface Disinfectant Market, 2016 – 2026 (USD Million)
      Fig.45 Global Research Laboratories Surface Disinfectant Market, 2016 – 2026 (Kilotons)
      Fig.46 Global Surface Disinfectant Market Share, by Region, 2019 & 2026 (USD Million)
      Fig.47 Global Surface Disinfectant Market Share, by Region, 2019 & 2026 (Kilotons)
      Fig.48 North America Surface Disinfectant Market, 2016 – 2026 (USD Million)
      Fig.49 North America Surface Disinfectant Market, 2016 – 2026 (Kilotons)
      Fig.50 U.S. Surface Disinfectant Market, 2016 – 2026 (USD Million)
      Fig.51 U.S. Surface Disinfectant  Market, 2016 – 2026 (Kilotons)
      Fig.52 Canada Surface Disinfectant Market, 2016 – 2026 (USD Million)
      Fig.53 Canada Surface Disinfectant  Market, 2016 – 2026 (Kilotons)
      Fig.54 Europe Surface Disinfectant Market, 2016 – 2026 (USD Million)
      Fig.55 Europe Surface Disinfectant Market, 2016 – 2026 (Kilotons)
      Fig.56 Germany Surface Disinfectant Market, 2016 – 2026 (USD Million)
      Fig.57 Germany Surface Disinfectant  Market, 2016 – 2026 (Kilotons)
      Fig.58 France Surface Disinfectant Market, 2016 – 2026 (USD Million)
      Fig.59 France Surface Disinfectant  Market, 2016 – 2026 (Kilotons)
      Fig.60 U.K. Surface Disinfectant Market, 2016 – 2026 (USD Million)
      Fig.61 U.K. Surface Disinfectant  Market, 2016 – 2026 (Kilotons)
      Fig.62 Italy Surface Disinfectant Market, 2016 – 2026 (USD Million)
      Fig.63 Italy Surface Disinfectant  Market, 2016 – 2026 (Kilotons)
      Fig.64 Spain Surface Disinfectant Market, 2016 – 2026 (USD Million)
      Fig.65 Spain Surface Disinfectant  Market, 2016 – 2026 (Kilotons)
      Fig.66 Rest of Europe Surface Disinfectant Market, 2016 – 2026 (USD Million)
      Fig.67 Rest of Europe Surface Disinfectant  Market, 2016 – 2026 (Kilotons)
      Fig.68 Asia Pacific Surface Disinfectant Market, 2016 – 2026 (USD Million)
      Fig.69 Asia Pacific Surface Disinfectant Market, 2016 – 2026 (Kilotons)
      Fig.70 China Surface Disinfectant Market, 2016 – 2026 (USD Million)
      Fig.71 China Surface Disinfectant  Market, 2016 – 2026 (Kilotons)
      Fig.72 Japan Surface Disinfectant Market, 2016 – 2026 (USD Million)
      Fig.73 Japan Surface Disinfectant  Market, 2016 – 2026 (Kilotons)
      Fig.74 India Surface Disinfectant Market, 2016 – 2026 (USD Million)
      Fig.75 India Surface Disinfectant  Market, 2016 – 2026 (Kilotons)
      Fig.76 South  Korea Surface Disinfectant Market, 2016 – 2026 (USD Million)
      Fig.77 South  Korea Surface Disinfectant  Market, 2016 – 2026 (Kilotons)
      Fig.78 South-East Asia Surface Disinfectant Market, 2016 – 2026 (USD Million)
      Fig.79 South-East Asia Surface Disinfectant  Market, 2016 – 2026 (Kilotons)
      Fig.80 Rest of Asia Pacific Surface Disinfectant Market, 2016 – 2026 (USD Million)
      Fig.81 Rest of Asia Pacific Surface Disinfectant  Market, 2016 – 2026 (Kilotons)
      Fig.82 Latin America Surface Disinfectant Market, 2016 – 2026 (USD Million)
      Fig.83 Latin America Surface Disinfectant Market, 2016 – 2026 (Kilotons)
      Fig.84 Brazil Surface Disinfectant Market, 2016 – 2026 (USD Million)
      Fig.85 Brazil Surface Disinfectant  Market, 2016 – 2026 (Kilotons)
      Fig.86 Mexico Surface Disinfectant Market, 2016 – 2026 (USD Million)
      Fig.87 Mexico Surface Disinfectant  Market, 2016 – 2026 (Kilotons)
      Fig.88 Rest of Latin America Surface Disinfectant Market, 2016 – 2026 (USD Million)
      Fig.89 Rest of Latin America Surface Disinfectant  Market, 2016 – 2026 (Kilotons)
      Fig.90 The Middle-East and Africa Surface Disinfectant Market, 2016 – 2026 (USD Million)
      Fig.91 The Middle-East and Africa Surface Disinfectant Market, 2016 – 2026 (Kilotons)
      Fig.92 GCC Countries Surface Disinfectant Market, 2016 – 2026 (USD Million)
      Fig.93 GCC Countries Surface Disinfectant  Market, 2016 – 2026 (Kilotons)
      Fig.94 South Africa Surface Disinfectant Market, 2016 – 2026 (USD Million)
      Fig.95 South Africa Surface Disinfectant  Market, 2016 – 2026 (Kilotons)
      Fig.96 Rest of Middle-East Africa Surface Disinfectant Market, 2016 – 2026 (USD Million)
      Fig.97 Rest of Middle-East Africa Surface Disinfectant  Market, 2016 – 2026 (Kilotons)
      Fig.98 Global Surface Disinfectant Production and Consumption, 2016 – 2026 (Kilotons)
      Fig.99 North America Surface Disinfectant Production and Consumption, 2016 – 2026 (USD Million) (Kilotons)
      Fig.100 Europe Surface Disinfectant Production and Consumption, 2016 – 2026 (USD Million) (Kilotons)
      Fig.101 Asia Pacific Surface Disinfectant Production and Consumption, 2016 – 2026 (USD Million) (Kilotons)
      Fig.102 Latin America Surface Disinfectant Production and Consumption, 2016 – 2026 (USD Million) (Kilotons)
      Fig.103 The Middle-East and Africa Surface Disinfectant Production and Consumption, 2016 – 2026 (USD Million) (Kilotons)
      Fig.104 Competitor Market Share – Revenue
      Fig.105 Competitor Market Share – Volume
      Fig.106 3M Group Revenue and Growth Rate
      Fig.107 3M Group Market Share
      Fig.108 Cantel Medical Corporation Revenue and Growth Rate
      Fig.109 Cantel Medical Corporation Market Share
      Fig.110 The Clorox Company Revenue and Growth Rate
      Fig.111 The Clorox Company Market Share
      Fig.112 Ecolab Inc. Revenue and Growth Rate
      Fig.113 Ecolab Inc. Market Share
      Fig.114 Procter & Gamble Revenue and Growth Rate
      Fig.115 Procter & Gamble Market Share
      Fig.116 Reckitt Benckiser Group plc. Revenue and Growth Rate
      Fig.117 Reckitt Benckiser Group plc. Market Share
      Fig.118 Diversey, Inc. Revenue and Growth Rate
      Fig.119 Diversey, Inc. Market Share
      Fig.120 STERIS plc Revenue and Growth Rate
      Fig.121 STERIS plc Market Share
      Fig.122 CarrollCLEAN Revenue and Growth Rate
      Fig.123 CarrollCLEAN Market Share
      Fig.124 Metrex Research, LLC. Revenue and Growth Rate
      Fig.125 Metrex Research, LLC. Market Share
      Fig.126 Whiteley Corporation Revenue and Growth Rate
      Fig.127 Whiteley Corporation Market Share
      Fig.128 GOJO Industries, Inc. Revenue and Growth Rate
      Fig.129 GOJO Industries, Inc. Market Share
      Fig.130 PAUL HARTMANN AG Revenue and Growth Rate
      Fig.131 PAUL HARTMANN AG Market Share
      Fig.132 Medline Industries, Inc. Revenue and Growth Rate
      Fig.133 Medline Industries, Inc. Market Share
      Fig.134 Pharmax Limited Revenue and Growth Rate
      Fig.135 Pharmax Limited Market Share
      Fig.136 PDI Inc. Revenue and Growth Rate
      Fig.137 PDI Inc. Market Share
      Fig.138 Betco Revenue and Growth Rate
      Fig.139 Betco Market Share
      Fig.140 GESCO Healthcare Pvt. Ltd. Revenue and Growth Rate
      Fig.141 GESCO Healthcare Pvt. Ltd. Market Share
      Fig.142 MEDALKAN Revenue and Growth Rate
      Fig.143 MEDALKAN Market Share
      Fig.144 Ruhof Revenue and Growth Rate
      Fig.145 Ruhof Market Share
      Fig.146 Contec Inc. Revenue and Growth Rate
      Fig.147 Contec Inc. Market Share
      Fig.148 Cetylite, Inc. Revenue and Growth Rate
      Fig.149 Cetylite, Inc. Market Share
      Fig.150 Micro-Scientific, LLC Revenue and Growth Rate
      Fig.151 Micro-Scientific, LLC Market Share
      Fig.152 Pal International Revenue and Growth Rate
      Fig.153 Pal International Market Share
      Fig.154 BHC, Inc. Revenue and Growth Rate
      Fig.155 BHC, Inc. Market Share
      Fig.156 Market Dynamics
      Fig.157 Global Surface Disinfectant – Value Chain Analysis
      Fig.158 Key Mandates and Regulations
      Fig.159 Technology Roadmap and Timeline
      Fig.160 Market Attractiveness Analysis – By Composition
      Fig.161 Market Attractiveness Analysis – By Type
      Fig.162 Market Attractiveness Analysis – By Application
      Fig.163 Market Attractiveness Analysis – By End-User
      Fig.164 Market Attractiveness Analysis – By Region
      Fig.165 Manufacturing Cost Structure of Surface Disinfectant
      Fig.166 Surface Disinfectant Industrial Chain Analysis
      Fig.167 Market Channels
      Fig.168 Marketing Channel Development Trend
      Fig.169 Growth in World Gross Product, 2008-2018

      List of Tables

      Table 1 Global Surface Disinfectant Market, 2019 & 2026 (USD Million)
      Table 2 Global Surface Disinfectant Market, by Composition, 2016 – 2026 (USD Million)
      Table 3 Global Surface Disinfectant Market, by Composition, 2016 – 2026 (Kilotons)
      Table 4 Global Surface Disinfectant Market, by Type, 2016 – 2026 (USD Million)
      Table 5 Global Surface Disinfectant Market, by Type, 2016 – 2026 (Kilotons)
      Table 6 Global Surface Disinfectant Market, by Application, 2016 – 2026 (USD Million)
      Table 7 Global Surface Disinfectant Market, by Application, 2016 – 2026 (Kilotons)
      Table 8 Global Surface Disinfectant Market, by End-User, 2016 – 2026 (USD Million)
      Table 9 Global Surface Disinfectant Market, by End-User, 2016 – 2026 (Kilotons)
      Table 10 Global Surface Disinfectant Market, by Region, 2016 – 2026 (USD Million)
      Table 11 Global Surface Disinfectant Market, by Region, 2016 – 2026 (Kilotons)
      Table 12 North America Surface Disinfectant Market, by Country, 2016 – 2026 (USD Million)
      Table 13 North America Surface Disinfectant Market, by Country, 2016 – 2026 (Kilotons)
      Table 14 North America Surface Disinfectant Market, by Composition, 2016 – 2026 (USD Million)
      Table 15 North America Surface Disinfectant Market, by Composition, 2016 – 2026 (Kilotons)
      Table 16 North America Surface Disinfectant Market, by Type, 2016 – 2026 (USD Million)
      Table 17 North America Surface Disinfectant Market, by Type, 2016 – 2026 (Kilotons)
      Table 18 North America Surface Disinfectant Market, by Application, 2016 – 2026 (USD Million)
      Table 19 North America Surface Disinfectant Market, by Application, 2016 – 2026 (Kilotons)
      Table 20 North America Surface Disinfectant Market, by End-User, 2016 – 2026 (USD Million)
      Table 21 North America Surface Disinfectant Market, by End-User, 2016 – 2026 (Kilotons)
      Table 22 Europe Surface Disinfectant Market, by Country, 2016 – 2026 (USD Million)
      Table 23 Europe Surface Disinfectant Market, by Country, 2016 – 2026 (Kilotons)
      Table 24 Europe Surface Disinfectant Market, by Composition, 2016 – 2026 (USD Million)
      Table 25 Europe Surface Disinfectant Market, by Composition, 2016 – 2026 (Kilotons)
      Table 26 Europe Surface Disinfectant Market, by Type, 2016 – 2026 (USD Million)
      Table 27 Europe Surface Disinfectant Market, by Type, 2016 – 2026 (Kilotons)
      Table 28 Europe Surface Disinfectant Market, by Application, 2016 – 2026 (USD Million)
      Table 29 Europe Surface Disinfectant Market, by Application, 2016 – 2026 (Kilotons)
      Table 30 Europe Surface Disinfectant Market, by End-User, 2016 – 2026 (USD Million)
      Table 31 Europe Surface Disinfectant Market, by End-User, 2016 – 2026 (Kilotons)
      Table 32 Asia Pacific Surface Disinfectant Market, by Country, 2016 – 2026 (USD Million)
      Table 33 Asia Pacific Surface Disinfectant Market, by Country, 2016 – 2026 (Kilotons)
      Table 34 Asia Pacific Surface Disinfectant Market, by Composition, 2016 – 2026 (USD Million)
      Table 35 Asia Pacific Surface Disinfectant Market, by Composition, 2016 – 2026 (Kilotons)
      Table 36 Asia Pacific Surface Disinfectant Market, by Type, 2016 – 2026 (USD Million)
      Table 37 Asia Pacific Surface Disinfectant Market, by Type, 2016 – 2026 (Kilotons)
      Table 38 Asia Pacific Surface Disinfectant Market, by Application, 2016 – 2026 (USD Million)
      Table 39 Asia Pacific Surface Disinfectant Market, by Application, 2016 – 2026 (Kilotons)
      Table 40 Asia Pacific Surface Disinfectant Market, by End-User, 2016 – 2026 (USD Million)
      Table 41 Asia Pacific Surface Disinfectant Market, by End-User, 2016 – 2026 (Kilotons)
      Table 42 Latin America Surface Disinfectant Market, by Country, 2016 – 2026 (USD Million)
      Table 43 Latin America Surface Disinfectant Market, by Country, 2016 – 2026 (Kilotons)
      Table 44 Latin America Surface Disinfectant Market, by Composition, 2016 – 2026 (USD Million)
      Table 45 Latin America Surface Disinfectant Market, by Composition, 2016 – 2026 (Kilotons)
      Table 46 Latin America Surface Disinfectant Market, by Type, 2016 – 2026 (USD Million)
      Table 47 Latin America Surface Disinfectant Market, by Type, 2016 – 2026 (Kilotons)
      Table 48 Latin America Surface Disinfectant Market, by Application, 2016 – 2026 (USD Million)
      Table 49 Latin America Surface Disinfectant Market, by Application, 2016 – 2026 (Kilotons)
      Table 50 Latin America Surface Disinfectant Market, by End-User, 2016 – 2026 (USD Million)
      Table 51 Latin America Surface Disinfectant Market, by End-User, 2016 – 2026 (Kilotons)
      Table 52 The Middle-East and Africa Surface Disinfectant Market, by Country, 2016 – 2026 (USD Million)
      Table 53 The Middle-East and Africa Surface Disinfectant Market, by Country, 2016 – 2026 (Kilotons)
      Table 54 The Middle-East and Africa Surface Disinfectant Market, by Composition, 2016 – 2026 (USD Million)
      Table 55 The Middle-East and Africa Surface Disinfectant Market, by Composition, 2016 – 2026 (Kilotons)
      Table 56 The Middle-East and Africa Surface Disinfectant Market, by Type, 2016 – 2026 (USD Million)
      Table 57 The Middle-East and Africa Surface Disinfectant Market, by Type, 2016 – 2026 (Kilotons)
      Table 58 The Middle-East and Africa Surface Disinfectant Market, by Application, 2016 – 2026 (USD Million)
      Table 59 The Middle-East and Africa Surface Disinfectant Market, by Application, 2016 – 2026 (Kilotons)
      Table 60 The Middle-East and Africa Surface Disinfectant Market, by End-User, 2016 – 2026 (USD Million)
      Table 61 The Middle-East and Africa Surface Disinfectant Market, by End-User, 2016 – 2026 (Kilotons)
      Table 62 North America Surface Disinfectant Production, Consumption, Export, Import, 2016 – 2019
      Table 63 Europe Surface Disinfectant Production, Consumption, Export, Import, 2016 – 2019
      Table 64 Asia Pacific Surface Disinfectant Production, Consumption, Export, Import, 2016 – 2019
      Table 65 Latin America Surface Disinfectant Production, Consumption, Export, Import, 2016 – 2019
      Table 66 The Middle-East and Africa Surface Disinfectant Production, Consumption, Export, Import, 2016 – 2019
      Table 67 Global Surface Disinfectant Market - Company Revenue Analysis, 2016 – 2019 (USD Million)
      Table 68 Global Surface Disinfectant Market - Company Revenue Share Analysis, 2016 – 2019 (%)
      Table 69 Global Surface Disinfectant Market - Company Volume Analysis, 2016 – 2019 (Kilotons)
      Table 70 Global Surface Disinfectant Market - Company Volume Share Analysis, 2016 – 2019 (%)
      Table 71 Acquisitions and Mergers
      Table 72 Market Drivers – Impact Analysis
      Table 73 Market Restraints
      Table 74 Market Opportunities
      Table 75 Production Base and Market Concentration Rate of Raw Material
      Table 76 Key Suppliers of Raw Materials
      Table 77 Raw Materials Sources of Surface Disinfectant Major Manufacturers
      Table 78 Major Buyers of Surface Disinfectant
      Table 79 Distributors/Traders of Surface Disinfectant by Region

Industry Major Market Players

  •  Cantel Medical Corporation
  •  3M Group
  •  The Clorox Company
  •  Procter & Gamble
  •  Ecolab Inc.
  •  Diversey Inc.
  •  Reckitt Benckiser Group plc.
  •  CarrollCLEAN
  •  STERIS plc
  •  Whiteley Corporation
  •  Metrex Research LLC.
  •  PAUL HARTMANN AG
  •  GOJO Industries Inc.
  •  Pharmax Limited
  •  Medline Industries Inc.
  •  Betco
  •  PDI Inc.
  •  MEDALKAN
  •  GESCO Healthcare Pvt. Ltd.
  •  Contec Inc.
  •  Ruhof
  •  Micro-Scientific LLC
  •  Cetylite Inc.
  •  Pal International