![]()
Search Market Research Report
Virtual Power Plants (VPP) Market Size, Share Global Analysis Report, 2024 – 2032

Virtual Power Plants (VPP) Market Size, Share, Growth Analysis Report By Technology (Demand Response, Distributed Generation, Mixed Asset), By End-User (Residential, Commercial, Industrial), And By Region - Global Industry Insights, Overview, Comprehensive Analysis, Trends, Statistical Research, Market Intelligence, Historical Data and Forecast 2024 – 2032
Industry Insights
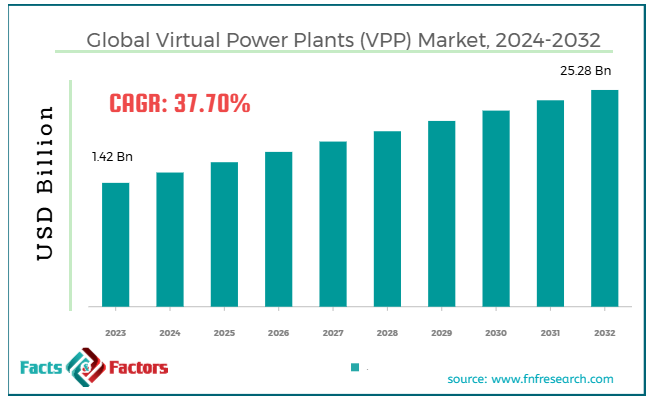
[221+ Pages Report] According to Facts & Factors, the global virtual power plants (VPP) market size was worth around USD 1.42 billion in 2023 and is predicted to grow to around USD 25.28 billion by 2032, with a compound annual growth rate (CAGR) of roughly 37.70% between 2024 and 2032.
 Market Overview
Virtual power plants (VPP) are systems of decentralized, usually renewable energy resources, such as wind turbines, solar panels, flexible energy consumers, and batteries, that are handled and aggregated via a central system. VPPs optimize and efficiently balance the consumption and production of such assets to reduce costs and improve grid stability and efficiency. The global virtual power plants (VPP) market is expected to grow considerably over the estimated period, owing to the rising integration of renewable energy sources, increasing demand for energy efficiency, and supportive government regulatory initiatives.
The global shift towards renewable energy, including hydro, wind, and solar, has increased the distribution of and recurrent power generation. Virtual power plants help incorporate these renewable energy sources by combining their results, balancing supply and demand, and promising grid stability.
As energy prices rise and ecological concerns increase, consumers and businesses actively emphasize enhancing energy efficiency. Virtual power plants can effectively combine diverse energy resources and improve their usage. This helps to reduce energy prices and enhance overall efficacy.
Furthermore, governments on a global scale are adopting incentives and policies to motivate clean energy generation, energy flexibility, and storage. VPPs can better capitalize on incentives like renewable energy quotas, tax credits, and energy storage subsidies, thus fueling the industry's growth.
Nevertheless, market and regulatory uncertainties and challenges in managing distributed resources are the key restraining factors to the market’s progress. The regulatory framework adjacent to virtual power plants is still developing in several regions. Uncertainty regarding grid codes, regulations, and market structures may restrict the adoption and investment in VPPs since companies may not be sure of the upcoming feasibility of these projects. Moreover, VPPs combine different distributed energy resources, which may complicate management due to variations in asset forms, operational characteristics, and locations.
Yet, the global market is opportune for integrating technologies and improvements in storage technologies. Incorporating AI algorithms and blockchain technology in VPPs may offer transparent and secure energy transactions, offering novel opportunities for virtual power plants. Also, as energy storage solutions constantly enhance grid storage alternates, the VPPs may face intense competition and provide more reliability concerning energy supply.
Key Insights:
- As per the analysis shared by our research analyst, the global virtual power plants (VPP) market is estimated to grow annually at a CAGR of around 37.70% over the forecast period (2024-2032)
- In terms of revenue, the global virtual power plants (VPP) market size was valued at around USD 1.42 billion in 2023 and is projected to reach USD 25.28 billion by 2032.
- The virtual power plants (VPP) market is projected to grow significantly, owing to the global shift towards renewable energy, elevated focus on energy efficiency, and improvement in IoT technology and smart grid.
- Based on technology, the demand response segment is expected to lead the market, while the distributed generation segment is expected to register considerable growth.
- Based on end-user, the residential segment is expected to lead the market compared to the commercial segment.
- Based on region, North America is projected to dominate the global market during the estimated period, followed by Europe.
Growth Drivers
- Technological developments in automation and energy management drive the virtual power plants (VPP) market growth
Virtual power plants depend on superior technologies, such as AI, IoT devices, and smart meters, to effectively handle distributed energy resources. This innovation enables real-time monitoring, automated decision-making, and predictive analytics, which boosts energy storage, generation, and consumption. This ultimately drives the global virtual power plant (VPP) industry.
The worldwide smart grid industry size was estimated at $ 30.13 billion in 2022 and is anticipated to progress at a 20.7% CAGR by 2030. The rise of smart grid technologies benefits virtual power plants since they depend on these services for efficient operations.
In the United States, virtual power plants are witnessing substantial attention, particularly in California, where the need for clean energy is surging. The leading companies, including Tesla and Pacific Gas and Electric (PG&E), are making efforts to incorporate smart grid technologies with virtual power plants, thus enhancing energy storage management and grid flexibility.
- Grid stability and reliability positively propel the market growth
Virtual power plants contribute to grid stability by enabling more flexible and responsive demand and supply management. By combining different distributed resources, virtual power plants offer grid operators enhanced flexibility to answer to heavy demand and sudden disturbances in energy supply.
A Texas VPP initiative known as ‘GridBridge' has been helping alleviate power outages due to intolerable weather conditions. Virtual power plants influence distributed energy resources like battery storage and solar energy to supply power when older plants miscarry.
Restraints
- Cybersecurity risks may negatively impact the virtual power plants (VPP) market progress
Virtual power plants rely on complex communication networks, remote monitoring systems, and data management to operate efficiently. This dependence on digital infrastructure increases the risk of cyber threats. A cyber threat pointing at a virtual power plant or its parts, like grid control systems or energy storage, may lead to grid failures, operational disturbances, or data breaches.
Cybercrime costs are projected to touch USD 10.5 trillion yearly by 2025, with utility and energy sectors leading, owing to their reliance on vital infrastructure.
The German Energy Grid was hacked in 2020, conceding systems in numerous renewable energy plants. These cyber threats are projected to rise as virtual power plants progress in influence and scale. The BSI has been making efforts to strengthen cybersecurity in the energy industry.
Opportunities
- Grid flexibility and modernization spur the virtual power plants (VPP) market growth
As the electricity mix becomes more decentralized and diverse, there is an elevating demand for grid innovations. Conventional grid systems are not dedicated to accommodating large-scale DERs like solar panels, electric vehicles, and wind turbines. Virtual power plants offer a unique opportunity to improve grid flexibility by allowing better management of distributed energy resources. This facilitates the incorporation of renewable energy sources and improves demand response.
The smart grid industry is anticipated to be valued at USD 88.18 by 2030, fueled by the integration of DERs and the need for grid innovations comprising those backed by VPPs.
The National Grid ESO in the United Kingdom commenced testing virtual power plants to efficiently manage energy demand, especially during heavy demand efficiently, and to offer flexibility to the national grid. These virtual power plants are observed as a solution to maintain grid stability better while growing reliance on renewable energy.
- Favorable government incentives and policies to contribute to the industry growth
Governments on a global scale are actively offering financial incentives, favorable regulatory policies, and subsidies to encourage clean energy technologies. This comprises support for virtual power plants like subsidies for energy storage, tax credits for renewable energy repayments, and regulatory frameworks that allow the combination of small-scale energy resources in larger VPPs. Such policies offer key opportunities for businesses and consumers to participate in virtual power plants, influencing the virtual power plant (VPPs) market growth.
Australia offers incentives and rebates for households to install batteries and solar panels, making it a prominent nation for adopting virtual power plants. Approximately 50,000 families are expected to participate in virtual power plants by 2025.
Challenges
- Integration issues and interoperability constrain the growth of the virtual power plants (VPP) market
One key challenge for the virtual power plants industry is the interoperability of diverse distributed energy resources like wind turbines, electric vehicles, battery storage systems, and solar panels. These resources mostly use diverse communication protocols, technologies, and data formats, thus complicating the integration in a sole VPP system. Smooth interaction among grid operators, DERs, and virtual power plant software needs technical standardization and improved coordination.
In California, virtual power plants have combated the intricate integration of diverse systems into the grid. Despite the state's substantial progress, the current obstacles associated with standardizing interaction between these grids and devices still prevail.
Report Scope
Report Attribute |
Details |
Market Size in 2023 |
USD 1.42 Billion |
Projected Market Size in 2032 |
USD 25.28 Billion |
CAGR Growth Rate |
37.70% CAGR |
Base Year |
2023 |
Forecast Years |
2024-2032 |
Key Market Players |
Tesla Energy, Ormat Technologies, Siemens AG, ENGIE, Next Kraftwerke, E.ON SE, Schneider Electric, AutoGrid, GreenSync, Centrica Business Solutions, Powerledger, Sonnen GmbH, Pacific Gas and Electric (PG&E), Brookfield Renewable Partners, Vattenfall, and others. |
Key Segment |
By Technology, By End-User, and Region |
Major Regions Covered |
North America, Europe, Asia Pacific, Latin America, and the Middle East &, Africa |
Purchase Options |
Request customized purchase options to meet your research needs. Explore purchase options |
Segmentation Analysis
The global virtual power plants (VPP) market is segmented based on technology, end-user, and region.
Based on technology, the global virtual power plant industry is divided into demand response, distributed generation, and mixed assets. The demand response segment is projected to grow substantially over the estimated period. The segment comprises curtailing or shifting electricity use during heavy demands to balance demand and supply effectively. Virtual power plants control demand response by combining DERs like industrial equipment, residential smart devices or appliances, and electric vehicle chargers to offer demand-side flexibility.
Conversely, the distributed generation segment is expected to witness a second-leading share in the global market. VPPs combine these DERs to enhance electricity consumption and generation.
Based on end-user, the global virtual power plant market is segmented as residential, commercial, and industrial. The residential segment currently holds a notable market share. The rising adoption of DERs like home batteries, solar panels, and smart home appliances mainly impacts this. Virtual power plants allow residential consumers to incorporate these resources, sell surplus energy back to the smart grid, and participate in demand response programs. This increases its popularity among homeowners willing to reduce their power costs and contribute to the grid's stability.
On the other hand, the commercial segment will progress notably, followed by the residential segment. Commercial businesses like retail stores, offices, and public structures heavily adopt VPPs to enhance energy efficiency, reduce prices, and improve energy consumption.
Regional Analysis
- North America to witness significant growth over the forecast period
North America registered a significant share of the global virtual power plants market in 2023 and is projected to continue its dominance over the forecast years as well. The reasons for this market growth comprise strong regulatory policies and support, technological advancements and infrastructure, and rising demand for renewable energy. Governments in the region are actively encouraging clean energy solutions like virtual power plants. Initiatives like incentives for renewable energy installations and demand response fuel the industry's growth.
The region has a strong base of technologically improved grid infrastructure and increased technological innovation. Integrating AI-based energy management systems, IoT, and smart meters is fueling the adoption of VPPs in North America. Furthermore, the region is increasing its contribution to renewable energy in the power generation mix.
Europe is projected to progress as the second-leading region in the virtual power plants (VPP) market, owing to ambitious goals for renewable energy, investment in smart grid technology, and strong regulatory backing. The region is leading in adopting renewable energy, emphasizing DERs in the smart grid.
Europe is also investing heavily in smart grid technology, which is essential for the progress of virtual power plants. Nations like France and Germany are the forerunners in launching advanced energy management systems and smart meters, allowing enhanced coordination of DERs (distributed energy resources). The region also holds favorable policies for energy flexibility and demand-side management, which are needed to operate virtual power plants efficiently. Nations like the UK, Germany, and France already use VPP-associated rules, prompting commercial and residential participation.
Competitive Analysis
The global virtual power plants (VPP) market is led by players like:
- Tesla Energy
- Ormat Technologies
- Siemens AG
- ENGIE
- Next Kraftwerke
- E.ON SE
- Schneider Electric
- AutoGrid
- GreenSync
- Centrica Business Solutions
- Powerledger
- Sonnen GmbH
- Pacific Gas and Electric (PG&E)
- Brookfield Renewable Partners
- Vattenfall
Key Market Trends
- The growing integration of renewable energy:
Virtual power plants actively integrate solar, energy storage systems, and wind to enhance energy management. With the worldwide inclination towards renewable energy, virtual power plants support the balance of recurrent energy generation by improving grid reliability and combining distributed energy resources.
- Rise in demand response programs:
There is a rising adoption of demand response (DR) programs as a component of virtual power plants. Grid operators and utilities use virtual power plants to handle peak demand and lower grid blocking. This will offer incentives to commercial and residential consumers who participate in shifting or reducing energy consumption during peak periods.
The global virtual power plants (VPP) market is segmented as follows:
By Technology Segment Analysis
- Demand Response
- Distributed Generation
- Mixed Asset
By End-User Segment Analysis
- Residential
- Commercial
- Industrial
By Regional Segment Analysis
- North America
- The U.S.
- Canada
- Mexico
- Europe
- France
- The UK
- Spain
- Germany
- Italy
- Rest of Europe
- Asia Pacific
- China
- Japan
- India
- Australia
- Southeast Asia
- Rest of Asia Pacific
- The Middle East & Africa
- Saudi Arabia
- UAE
- Egypt
- Kuwait
- South Africa
- Rest of the Middle East & Africa
- Latin America
- Brazil
- Argentina
- Rest of Latin America
Table of Content
Industry Major Market Players
- Tesla Energy
- Ormat Technologies
- Siemens AG
- ENGIE
- Next Kraftwerke
- E.ON SE
- Schneider Electric
- AutoGrid
- GreenSync
- Centrica Business Solutions
- Powerledger
- Sonnen GmbH
- Pacific Gas and Electric (PG&E)
- Brookfield Renewable Partners
- Vattenfall


Copyright © 2024 - 2025, All Rights Reserved, Facts and Factors