Search Market Research Report

Discover Our Latest Reports
Discover Our Featured Reports
Discover Top Selling Reports

E-KYB Market Size, Share, Demand & Trends Analysis Forecast 2020-2026

report img

E-KYB Market By End-Users (Banks, E-payment Service Providers, Financial Institutions, Government Entities, Insurance Companies, Telecom Companies, and Others): Global Industry Perspective, Comprehensive Analysis, and Forecast, 2020 – 2026

Industry Insights

[225+ Pages Report] According to the report published by Facts and Factors, the global E-KYB market size was valued around USD 133.19 million in 2019 and is expected to grow to around USD 318.11 million by 2026 with a compound annual growth rate (CAGR) of roughly 16.01% between 2020 and 2026. The report analyzes the global E-KYB market drivers, challenges, and the impact they have on the demands during the forecast period. In addition, the report explores emerging opportunities in the E-KYB market.
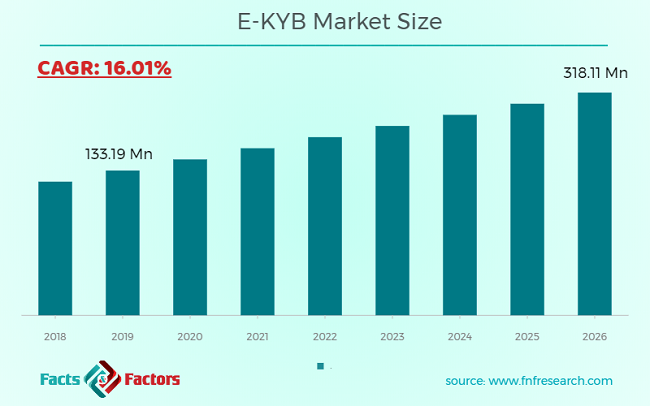
E-KYB Market Size

To know more about this report | Request Free Sample Copy

logoMarket Overview

KYB is an extension of the KYC. Know your business is used primarily to minimize the laundering of money. In order to check if the company of companies participated in an illicit activity such as money washing, terrorism finance, corruption, etc., it is screened against blacklists and gray lists during the Know Your Business process. In detecting bogus firms and shell firms, KYB is critical, as it is also essential to efficient enforcement with KYC and AML. Digital fraud and crime were interested in vast numbers of businesses because of digitization. Due to the increasing pressure on enforcement by companies, the popularity of KYC and KYB solutions and services has grown.

logoIndustry Growth Factors

The digitalization of KYC, as well as KYB, has ensured that the bottlenecks are minimized during internal and external investigations, customer on-boarding, purchase management, etc. The digitalization process will allow organizations to make online verification management a simple and stress-free process and to comply with regulatory requirements. It also supports institutions in providing fast and friendly service to consumers. E-KYB also helps eradicate forgery by offering automated authentication and recognition and address data validation in real-time, allowing quick documentation.

In addition, increased investments in banking digitalization have played an essential role in driving the e-KYB industry. Globally investments have grown from $153 million in 2010 to $6.99 billion in 2015 in the digital banks sector. This investment has contributed to a growth in the worldwide number of digital banking users. Digital baking has also contributed to a growth in the number of consumers in developing countries. In 2018, approximately 75% of millennia in the United States have been using automated banks, up to 77.6% by 2022, according to Statista.

E-KYB Market

To know more about this report | Request Free Sample Copy

logoGlobal E-KYB Market: Segmentation

Based on end-user the market is divided into banks, e-payment service providers, financial institutions, government entities, insurance companies, telecom companies, and others.

Among these, the banking sector is the primary end-use industry of the global e-KYB market in 2019. In 2019, the share of the overall market was 34.65 percent. The banks are taking action with regard to compliance with many laws, such as the anti-money laundering law (AML) and the terrorist funding regulation (CFT). KYB is a way of preventing banks from participating in illegal or terrorist activities while helping them to maintain international compliance with required laws. By verifying full details and collecting such records from reputable sources, the banks undertake their KYB specifications.

logoReport Scope

Report Attribute

Details

Market Size in 2019

USD 133.19 Million

Projected Market Size in 2026

USD 318.11 Million

CAGR Growth Rate

16.01% CAGR

Base Year

2019

Forecast Years

2020-2026

Key Market Players

IDnow, Jumio, Onfido, Shufti Pro, Trulioo, and TruNarrative among others.

Key Segment

By End-Users, and Region

Major Regions Covered

North America, Europe, Asia Pacific, Latin America, and the Middle East & Africa

Purchase Options

Request customized purchase options to meet your research needs. Explore purchase options

logoGlobal E-KYB Market: Regional Analysis

In terms of region, the global e-KYB market is classified into major regions including Asia Pacific, North America, Latin America, Europe, and Middle East & Africa. In 2019, North America led the e-KYB industry among these countries. In 2019, the overall sector constituted 43.60% of shares. The United States is a big player in the region's economy. During 2019, it retained 88.76% of the global market. The Asia Pacific is also expected to be the fastest-growing e-KYB market in the forecast timeframe.

The second biggest e-KYB market in 2019 in Europe. Europe. In 2019, it had a 30.02% market share. In addition, the project duration is expected to rise at a CAGR of 15.7%. The largest market share in the region is shared by Germany, UK, and France. In 2019, they represented 67.19% of the total region. The exponential development of the e-KYB industry in the area over future years can be seen by the growing penetration of technical progress.

logoGlobal E-KYB Market: Competitive Players

Some of the key players in the E-KYB Market are :

  • TruNarrative
  • Trulioo
  • Jumio
  • IDnow
  • Onfido
  • Shufti Pro

logoGlobal E-KYB Market: Regional Segment Analysis

  • North America
    • U.S.
    • Canada
  • Europe
    • U.K.
    • France
    • Germany
  • The Asia Pacific
    • China
    • Japan
    • India
  • Latin America
    • Brazil
    • Mexico
  • The Middle East and Africa

Table of Content

  1. Chapter 1 Executive Summary
    1. 1.1. Introduction of E-KYB
    2. 1.2. Global E-KYB Market, 2019 & 2026 (USD Million)
    3. 1.3. Global E-KYB Market, 2016 – 2026 (USD Million)
    4. 1.4. Global E-KYB Market Absolute Revenue Opportunity, 2016 – 2026 (USD Million)
    5. 1.5. Global E-KYB Market Incremental Revenue Opportunity, 2020 – 2026 (USD Million)
  2. Chapter 2 E-KYB Market – End-Users Analysis
    1. 2.1. Global E-KYB Market – End-Users Overview
    2. 2.2. Global E-KYB Market Share, by End-Users, 2019 & 2026 (USD Million)
    3. 2.3. Banks
      1. 2.3.1. Global Banks E-KYB Market, 2016 – 2026 (USD Million)
    4. 2.4. Financial Institutions
      1. 2.4.1. Global Financial Institutions E-KYB Market, 2016 – 2026 (USD Million)
    5. 2.5. E-payment Service Providers
      1. 2.5.1. Global E-payment Service Providers E-KYB Market, 2016 – 2026 (USD Million)
    6. 2.6. Telecom Companies
      1. 2.6.1. Global Telecom Companies E-KYB Market, 2016 – 2026 (USD Million)
    7. 2.7. Government Entities
      1. 2.7.1. Global Government Entities E-KYB Market, 2016 – 2026 (USD Million)
    8. 2.8. Insurance Companies
      1. 2.8.1. Global Insurance Companies E-KYB Market, 2016 – 2026 (USD Million)
    9. 2.9. Others
      1. 2.9.1. Global Others E-KYB Market, 2016 – 2026 (USD Million)
  3. Chapter 3 E-KYB Market – Regional Analysis
    1. 3.1. Global E-KYB Market Regional Overview
    2. 3.2. Global E-KYB Market Share, by Region, 2019 & 2026 (USD Million)
    3. 3.3. North America
      1. 3.3.1. North America E-KYB Market, 2016 – 2026 (USD Million)
      2. 3.3.2. North America E-KYB Market, by End-Users, 2016 – 2026
      3. 3.3.3. U.S.
      4. 3.3.4. Canada
    4. 3.4. Europe
      1. 3.4.1. Europe E-KYB Market, 2016 – 2026 (USD Million)
      2. 3.4.2. Europe E-KYB Market, by End-Users, 2016 – 2026
      3. 3.4.3. Germany
      4. 3.4.4. France
      5. 3.4.5. U.K.
      6. 3.4.6. Italy
      7. 3.4.7. Spain
      8. 3.4.8. Rest of Europe
    5. 3.5. Asia Pacific
      1. 3.5.1. Asia Pacific E-KYB Market, 2016 – 2026 (USD Million)
      2. 3.5.2. Asia Pacific E-KYB Market, by End-Users, 2016 – 2026
      3. 3.5.3. China
      4. 3.5.4. Japan
      5. 3.5.5. India
      6. 3.5.6. SouthKorea
      7. 3.5.7. South-East Asia
      8. 3.5.8. Rest of Asia Pacific
    6. 3.6. Latin America
      1. 3.6.1. Latin America E-KYB Market, 2016 – 2026 (USD Million)
      2. 3.6.2. Latin America E-KYB Market, by End-Users, 2016 – 2026
      3. 3.6.3. Brazil
      4. 3.6.4. Mexico
      5. 3.6.5. Rest of Latin America
    7. 3.7. The Middle-East and Africa
      1. 3.7.1. The Middle-East and Africa E-KYB Market, 2016 – 2026 (USD Million)
      2. 3.7.2. The Middle-East and Africa E-KYB Market, by End-Users, 2016 – 2026
      3. 3.7.3. GCC Countries
      4. 3.7.4. South Africa
      5. 3.7.5. Rest of Middle-East Africa
  4. Chapter 4 E-KYB Market – Competitive Landscape
    1. 4.1. Competitor Market Share – Revenue
    2. 4.2. Market Concentration Rate Analysis, Top 3 and Top 5 Players
    3. 4.3. Strategic Developments
      1. 4.3.1. Acquisitions and Mergers
      2. 4.3.2. New Products
      3. 4.3.3. Research & Development Activities
  5. Chapter 5 Company Profiles
    1. 5.1. TruNarrative
      1. 5.1.1. Company Overview
      2. 5.1.2. Product/Service Portfolio
      3. 5.1.3. TruNarrative Sales, Revenue, and Gross Margin
      4. 5.1.4. TruNarrative Revenue and Growth Rate
      5. 5.1.5. TruNarrative Market Share
      6. 5.1.6. Recent Initiatives, Funding/VC Activities, and Technological Innovations
    2. 5.2. Trulioo
      1. 5.2.1. Company Overview
      2. 5.2.2. Product/Service Portfolio
      3. 5.2.3. Trulioo Sales, Revenue, and Gross Margin
      4. 5.2.4. Trulioo Revenue and Growth Rate
      5. 5.2.5. Trulioo Market Share
      6. 5.2.6. Recent Initiatives, Funding/VC Activities, and Technological Innovations
    3. 5.3. Jumio
      1. 5.3.1. Company Overview
      2. 5.3.2. Product/Service Portfolio
      3. 5.3.3. Jumio Sales, Revenue, and Gross Margin
      4. 5.3.4. Jumio Revenue and Growth Rate
      5. 5.3.5. Jumio Market Share
      6. 5.3.6. Recent Initiatives, Funding/VC Activities, and Technological Innovations
    4. 5.4. IDnow
      1. 5.4.1. Company Overview
      2. 5.4.2. Product/Service Portfolio
      3. 5.4.3. IDnow Sales, Revenue, and Gross Margin
      4. 5.4.4. IDnow Revenue and Growth Rate
      5. 5.4.5. IDnow Market Share
      6. 5.4.6. Recent Initiatives, Funding/VC Activities, and Technological Innovations
    5. 5.5. Onfido
      1. 5.5.1. Company Overview
      2. 5.5.2. Product/Service Portfolio
      3. 5.5.3. Onfido Sales, Revenue, and Gross Margin
      4. 5.5.4. Onfido Revenue and Growth Rate
      5. 5.5.5. Onfido Market Share
      6. 5.5.6. Recent Initiatives, Funding/VC Activities, and Technological Innovations
    6. 5.6. Shufti Pro
      1. 5.6.1. Company Overview
      2. 5.6.2. Product/Service Portfolio
      3. 5.6.3. Shufti Pro Sales, Revenue, and Gross Margin
      4. 5.6.4. Shufti Pro Revenue and Growth Rate
      5. 5.6.5. Shufti Pro Market Share
      6. 5.6.6. Recent Initiatives, Funding/VC Activities, and Technological Innovations
  6. Chapter 6 E-KYB — Industry Analysis
    1. 6.1. Introduction and Taxonomy
    2. 6.2. E-KYB Market – Key Trends
      1. 6.2.1. Market Drivers
      2. 6.2.2. Market Restraints
      3. 6.2.3. Market Opportunities
    3. 6.3. Value Chain Analysis
    4. 6.4. Key Mandates and Regulations
    5. 6.5. Technology Roadmap and Timeline
    6. 6.6. E-KYB Market – Attractiveness Analysis
      1. 6.6.1. By End-Users
      2. 6.6.2. By Region
  7. Chapter 7 Industrial Chain, Sourcing Strategy, and Downstream Buyers
    1. 7.1. E-KYB Industrial Chain Analysis
    2. 7.2. Downstream Buyers
    3. 7.3. Distributors/Traders List
  8. Chapter 8 Marketing Strategy Analysis
    1. 8.1. Marketing Channel
    2. 8.2. Direct Marketing
    3. 8.3. Indirect Marketing
    4. 8.4. Marketing Channel Development Trends
    5. 8.5. Economic/Political Environmental Change
  9. Chapter 9 Report Conclusion & Key Insights
    1. 9.1. Key Insights from Primary Interviews & Surveys Respondents
    2. 9.2. Key Takeaways from Analysts, Consultants, and Industry Leaders
  10. Chapter 10 Research Approach & Methodology
    1. 10.1. Report Description
    2. 10.2. Research Scope
    3. 10.3. Research Methodology
      1. 10.3.1. Secondary Research
      2. 10.3.2. Primary Research
      3. 10.3.3. Statistical Models
      4. 10.3.4. Research Limitations

      List of Figures

      Fig.1	Product Picture of E-KYB
      Fig.2	Global E-KYB Market, 2016 – 2026 (USD Million)
      Fig.3	Global E-KYB Market Absolute Revenue Opportunity, 2016 – 2026 (USD Million)
      Fig.4	Global E-KYB Market Incremental Revenue Opportunity, 2020 – 2026 (USD Million)
      Fig.5	Global E-KYB Market Share, by End-Users, 2019 & 2026 (USD Million)
      Fig.6	Global Banks E-KYB Market, 2016 – 2026 (USD Million)
      Fig.7	Global Financial Institutions E-KYB Market, 2016 – 2026 (USD Million)
      Fig.8	Global E-payment Service Providers E-KYB Market, 2016 – 2026 (USD Million)
      Fig.9	Global Telecom Companies E-KYB Market, 2016 – 2026 (USD Million)
      Fig.10	Global Government Entities E-KYB Market, 2016 – 2026 (USD Million)
      Fig.11	Global Insurance Companies E-KYB Market, 2016 – 2026 (USD Million)
      Fig.12	Global Others E-KYB Market, 2016 – 2026 (USD Million)
      Fig.13	Global E-KYB Market Share, by Region, 2019 & 2026 (USD Million)
      Fig.14	North America E-KYB Market, 2016 – 2026 (USD Million)
      Fig.15	U.S. E-KYB Market, 2016 – 2026 (USD Million)
      Fig.16	Canada E-KYB Market, 2016 – 2026 (USD Million)
      Fig.17	Europe E-KYB Market, 2016 – 2026 (USD Million)
      Fig.18	Germany E-KYB Market, 2016 – 2026 (USD Million)
      Fig.19	France E-KYB Market, 2016 – 2026 (USD Million)
      Fig.20	U.K. E-KYB Market, 2016 – 2026 (USD Million)
      Fig.21	Italy E-KYB Market, 2016 – 2026 (USD Million)
      Fig.22	Spain E-KYB Market, 2016 – 2026 (USD Million)
      Fig.23	Rest of Europe E-KYB Market, 2016 – 2026 (USD Million)
      Fig.24	Asia Pacific E-KYB Market, 2016 – 2026 (USD Million)
      Fig.25	China E-KYB Market, 2016 – 2026 (USD Million)
      Fig.26	Japan E-KYB Market, 2016 – 2026 (USD Million)
      Fig.27	India E-KYB Market, 2016 – 2026 (USD Million)
      Fig.28	SouthKorea E-KYB Market, 2016 – 2026 (USD Million)
      Fig.29	South-East Asia E-KYB Market, 2016 – 2026 (USD Million)
      Fig.30	Rest of Asia Pacific E-KYB Market, 2016 – 2026 (USD Million)
      Fig.31	Latin America E-KYB Market, 2016 – 2026 (USD Million)
      Fig.32	Brazil E-KYB Market, 2016 – 2026 (USD Million)
      Fig.33	Mexico E-KYB Market, 2016 – 2026 (USD Million)
      Fig.34	Rest of Latin America E-KYB Market, 2016 – 2026 (USD Million)
      Fig.35	The Middle-East and Africa E-KYB Market, 2016 – 2026 (USD Million)
      Fig.36	GCC Countries E-KYB Market, 2016 – 2026 (USD Million)
      Fig.37	South Africa E-KYB Market, 2016 – 2026 (USD Million)
      Fig.38	Rest of Middle-East Africa E-KYB Market, 2016 – 2026 (USD Million)
      Fig.39	Competitor Market Share – Revenue
      Fig.40	TruNarrative Revenue and Growth Rate
      Fig.41	TruNarrative Market Share
      Fig.42	Trulioo Revenue and Growth Rate
      Fig.43	Trulioo Market Share
      Fig.44	Jumio Revenue and Growth Rate
      Fig.45	Jumio Market Share
      Fig.46	IDnow Revenue and Growth Rate
      Fig.47	IDnow Market Share
      Fig.48	Onfido Revenue and Growth Rate
      Fig.49	Onfido Market Share
      Fig.50	Shufti Pro Revenue and Growth Rate
      Fig.51	Shufti Pro Market Share
      Fig.52	Market Dynamics
      Fig.53	Global E-KYB – Value Chain Analysis
      Fig.54	Key Mandates and Regulations
      Fig.55	Technology Roadmap and Timeline
      Fig.56	Market Attractiveness Analysis – By End-Users
      Fig.57	Market Attractiveness Analysis – By Region
      Fig.58	E-KYB Industrial Chain Analysis
      Fig.59	Market Channels
      Fig.60	Marketing Channel Development Trend
      Fig.61	Growth in World Gross Product, 2008-2018
      

      List of Tables

      Table 1 Global E-KYB Market, 2019 & 2026 (USD Million)
      Table 2 Global E-KYB Market, by End-Users, 2016 – 2026 (USD Million)
      Table 3 Global E-KYB Market, by Region, 2016 – 2026 (USD Million)
      Table 4 North America E-KYB Market, by Country, 2016 – 2026 (USD Million)
      Table 5 North America E-KYB Market, by End-Users, 2016 – 2026 (USD Million)
      Table 6 Europe E-KYB Market, by Country, 2016 – 2026 (USD Million)
      Table 7 Europe E-KYB Market, by End-Users, 2016 – 2026 (USD Million)
      Table 8 Asia Pacific E-KYB Market, by Country, 2016 – 2026 (USD Million)
      Table 9 Asia Pacific E-KYB Market, by End-Users, 2016 – 2026 (USD Million)
      Table 10 Latin America E-KYB Market, by Country, 2016 – 2026 (USD Million)
      Table 11 Latin America E-KYB Market, by End-Users, 2016 – 2026 (USD Million)
      Table 12 The Middle-East and Africa E-KYB Market, by Country, 2016 – 2026 (USD Million)
      Table 13 The Middle-East and Africa E-KYB Market, by End-Users, 2016 – 2026 (USD Million)
      Table 14 Global E-KYB Market - Company Revenue Analysis, 2016 – 2019 (USD Million)
      Table 15 Global E-KYB Market - Company Revenue Share Analysis, 2016 – 2019 (%)
      Table 16 Acquisitions and Mergers
      Table 17 Market Drivers – Impact Analysis
      Table 18 Market Restraints
      Table 19 Market Opportunities
      Table 20 Major Buyers of E-KYB
      Table 21 Distributors/Traders of E-KYB by Region
      

Industry Major Market Players

  • TruNarrative
  • Trulioo
  • Jumio
  • IDnow
  • Onfido
  • Shufti Proamong